
OpenStack is a very fashionable word in today’s IT media space. Virtually everyone heard about it, but not so many have seen it in action. Moreover, only a few dared to taste it in a “serious way”. In our company, we took this risk and, today, I’ll tell you what happened to us and why the fashion often runs ahead of prudence and stability.
In one of previous issues, we have already presented a brief overview of “pocket cloud infrastructure”, but it’s an ancient history now (only imagine that it was almost three years ago). Just in case, here is a brief summary: OpenStack is an open source (Apache License 2.0) platform that allows you, with a relatively small effort, to organize a cloud-based infrastructure à la Amazon Web Services on any number of hardware servers. This provides you with the ability of scaling virtual machines, live migration, load balancing by nodes and resiliency to failure of a certain percentage of nodes. Its major developers include the famous NASA and Rackspace, Red Hat, Canonical, IBM, AT&T and some other corporations. Overall, this is a good and very practical idea, since such a tool, in theory, would be useful in developing various new systems and services while allowing, on the go, to juggle with infrastructure and experiment with architecture. But all this is rather in theory and according to official description. However, what happens in real life?
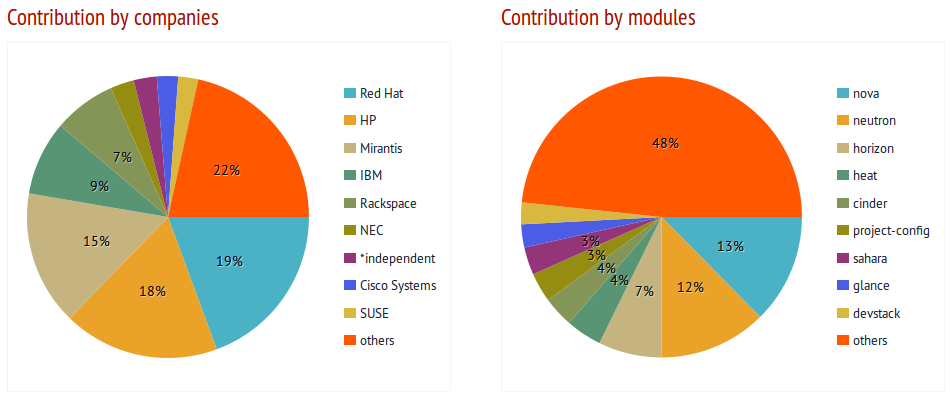
Most Involved Developers
Story 1
In real life, everything is much more complicated. OpenStack is like a pregnancy at sixteen. Usually, it is much easier to get it than to adequately coexist afterwards. This realization will come in a day, week, or if you’re lucky, it will come in a month. For example, in a not-so-beautiful day, for some reason, the virtual machines will simply stop to be created. Everything seems to be OK, everything is in place – disk space, available computing power, IP addresses in the network. But no, the system just hangs while Creating Instance, and that’s all. Half an hour, one hour, two, five, and nothing happens. There is “silence” in the logs. A few more hours spent on Google, then, at random, we reboot the “Rabbit” and… Whoa! Suddenly, everything starts to work. Virtual machines are being created, they are up and running, and all is good again. The question, “What was that?” hangs in the air.
Story 2
A month later, let’s say, Hetzner that hosts your servers running the OpenStack decides to perform some technical work on power supply. And, as it turns out, this work will include your Compute node. Well in advance, you stop all services running on this node and manually shut down the server. You wait the required couple of hours, then the node is up and running after the end of technical work. But the problem is that everything else is down. There is not a single available virtual machine. You go to control panel. At first glance, everything looks fine, just as it should be. Again, this is odd. You manually go to the server by using SSH, ‘virsh list’. The virtual machines are in place, they run, you try ‘virsh -c qemu+ssh://username@host/system’ — Whoa! No route to host. How come? You run ‘ifconfig && iptables-save’, there are no network interfaces. Logs, Google, logs, Google, logs, logs, Google… All this fails to move things out of the deadlock. By force of your old Windows-based habits, you decide to restart the server at random, one more time. Just in case. The server reboots and everything is up and running. You try to avoid any “abrupt moves”, exit the stack panel and the server and swear to touch it as rarely as possible.
Misadventure
As it has been already felt by those few who dared to use OpenStack in some commercial operations, it is “not ready for the desktop” yet. So far, unfortunately, it does not give you the pleasure to limit your user experience only to clicking the buttons in its web interface for creating new virtual machines and distributing the access to them. Just one step to the left or one step to the right — and you can stumble on something that “even” Google has nothing to say about. In such case, the debugging may take not only more than one day, but even more than one week. The guys in one well-known company — provider of ready-made solutions based on OpenStack — compare this process with [building a house] (goo.gl/LTrRKs):
“When you talk about OpenStack, the good analogy is the house. OpenStack is based on a variety of complex open source projects, cobbled together through various APIs, which often baffle even the most hardheaded engineers. From a business perspective, any attempt to figure this out on your own may adversely affects the period of project delivery and achievement of established goals. A “Do-It-Yourself” approach is still very popular among OpenStack novices and this often prevents them from getting any satisfactory outcome, which is the reason why the opinion about the entire system is not very flattering.
In this case, the primary goal of ready-made solution provider is to assist in designing and deploying a reliable platform for customer’s projects. The key point in this issue is to make the right choice of experienced provider who will be able to collect all necessary parts of the system, connect them correctly, and continue to support the outcome. Please, entrust your OpenStack support to a tried-and-tested provider.”
In a way, one cannot but agree with what they say. Not everyone can afford to spend so many hours of their system administrator’s time even on the banal maintenance of the current system performance, not to mention its further development.
New Features
While the vagaries of OpenStack performance are, to some extent, a “stable issue” (and subject of many jokes), the new features of the project, in my opinion, deserve more attention.
Heat
Heat is the main tool of orchestration used in the world of OpenStack. It allows you to launch ready-made cloud-based architectures from the templates described by the text that acts as a sort of programming code. Heat templates have their own native format but, in addition, they are compatible with AWS CloudFormation. Therefore, you can run many ready-made CloudFormation templates within OpenStack. Heat can communicate with the outside world both through its native OpenStack ReST API and compatible CloudFormation Query API.
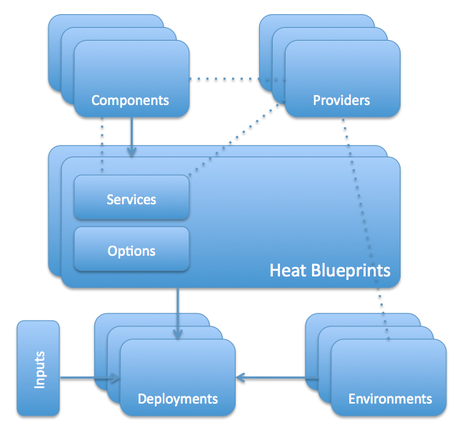
Heat Architecture
How does it work?
- Cloud infrastructure templates are ordinary and, to a moderate extent, human-readable plain-text documents that can be stored in version control systems, easily compared, patched, etc.
- List of infrastructure elements available for description in templates: servers, IP addresses, volumes, security groups, users, keys, etc.
- Heat allows to organize the automatic scaling under the load when integrated with Ceilometer (described a little further on).
- Naturally, the template also describes not only individual resources, but also their relationship — binding volumes and addresses to specific servers, assigning specific servers for specific security groups, distributing access to servers between the users and much more. This allows you to automate to the maximum extent the deployment of necessary infrastructure via the OpenStackAPI while avoiding additional manual interference.
- Heat also controls changes in the infrastructure. When you need to change something, just make the necessary modifications to the appropriate template and update the Heat configuration. It will find out the rest and bring everything to the standard.
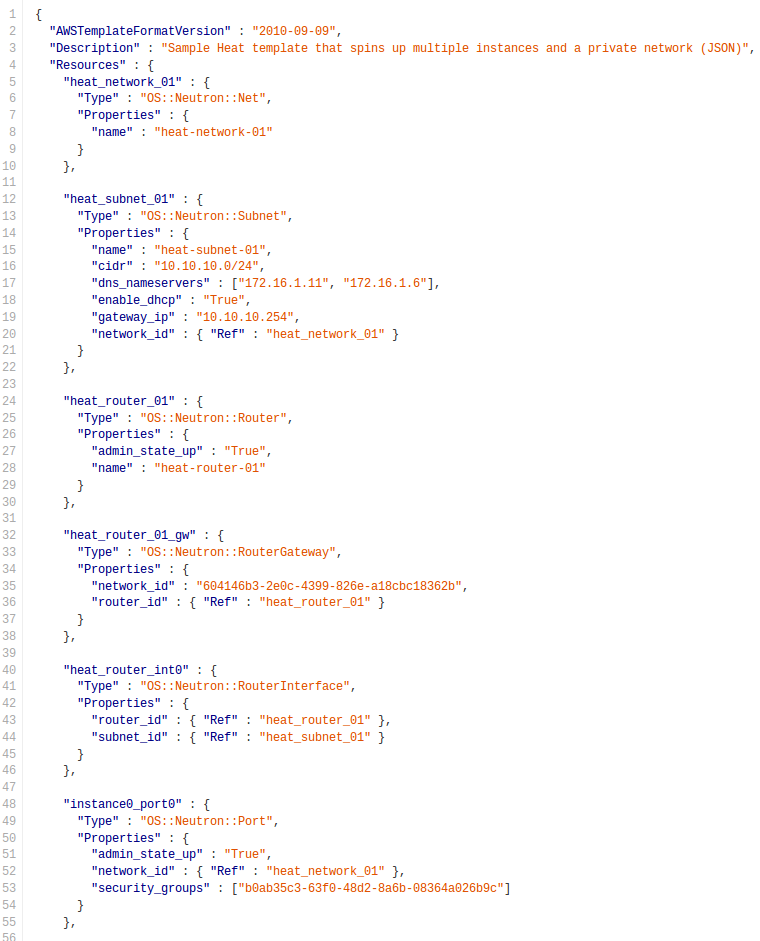
A Chunk of Sample Heat Template
Did you notice anything familiar in this? That’s right, we have seen similar ideas in such projects as Chef and Puppet. Whether to use it or not is up to you. People say Heat even provides for some sort of integration with them, but we didn’t try it, so, unfortunately, I have no additional details.
Ceilometer
Ceilometer is a tool for collecting various statistical data in the OpenStack cloud. The primary goal of the project is to monitor the load and measure the resource consumption by the clients, but the framework features can be extended for other purposes. You can obtain the access to metrics through a separately implemented REST API.
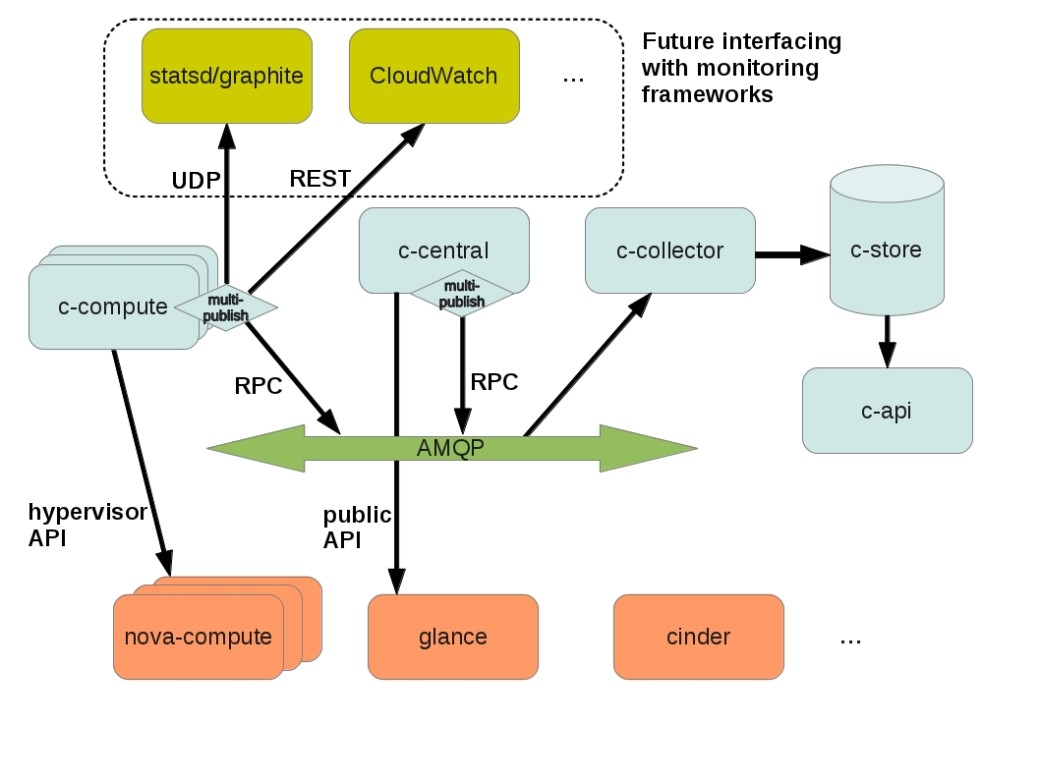
Ceilometer Architecture
The Central Agent queries the data on utilization of resources that are not associated with the virtual machines or Compute nodes. Each Ceilometer system can run only one Central Agent.
The Compute Agent collects the measurement data and statistics from Compute nodes (mainly, from hypervisor). The Compute Agent must be running on each Compute node whose status you want to monitor.
The Collector monitors the message queue (for notifications sent by infrastructure and measurements collected by agents). The notifications are processed, converted into measurement data and then signed and returned to the messaging bus for the appropriate topic. The Collector may run on one or more control servers.
The Data Store is a database that can simultaneously process the recording (by one or more collectors) and reading of data (from server API). The Collector, Central Agent and API can run on any node.
These services communicate via standard OpenStack messaging bus. Only the Collector and API server have access to the Data Store. Ceilometer supports SQL databases compatible with SQLAlchemy, as well as MongoDB and HBase. However, the developers of Ceilometer recommend MongoDB, because it can more efficiently process simultaneous reading / writing of data. In addition, only the configuration of Ceilometer with MongoDB has undergone extensive testing and deployment in commercial environments. For Ceilometer database, it is recommended to use a dedicated node, since the infrastructure can create a significant load on the database. According to developers, the measurement of infrastructure at the commercial level implies up to 386 records per second and 33,360,480 events per day, which would require up to 239 GB of storage for monthly statistics.
Ceilometer Architecture
The Ceilometer project provides for three types of measurements:
- Cumulative: they can also be called incremental — these are values that are increasing all the time (such as a virtual machine uptime);
- Gauge: individual events and values (such as IP addresses linked to a particular server, or disk subsystem input/output data);
- Delta: change over time (such as, network throughput).
Each collector collects data from one or more samples (collected from the message queue or by agents), which are provided by counters. Each counter has the following fields:
- counter_name. This is the line with the counter name. By convention, the point is used as a separator in the transition from the least specific word to the most specific word (for example, disk.ephemeral.size);
- counter_type. This is the counter type (cumulative, indicator, delta, see above);
- counter_volume. This is the volume of measured data (CPU cycles, number of bytes transmitted through the network, virtual machine deployments, etc.). This field is not essential for the indicator-type counters; in this case, it should be set to a default value (usually ‘1’);
- counter_unit. This is the description of measurement unit used by the counter. It uses SI units and their approved abbreviations. The amount of information should be expressed in bits (b) or bytes (B). When the measurement is not an amount of data, the description must always contain the exact information of what is being measured (virtual machines, disk volumes, IP addresses, etc.);
- resource_id. This is the measured resource identifier (UUID of the virtual machine, network, image);
- project_id. This is the ID of the project that owns the resource;
- user_id. This is the identifier of the user that owns the resource;
- resource_metadata. This is some additional metadata to provide more information in the measurement report.
You can find the full list of currently available measurements in Ceilometer documentation (https://wiki.openstack.org/wiki/Ceilometer).
Ceilometer is a rather promising project, which aims at unifying the capabilities of collecting information on all aspects of cloud-based infrastructure. By using Ceilometer, you can put your “pocket cloud” on a sufficiently strong commercial footing.
The End
As you can see, all is not as simple as it seems. There is place both for troubles and adventures. OpenStack is developing very rapidly, but it is still not ready for quick and easy use in the commercial operations, just like some commercial virtualization products of previous generation.
If virtualization is among the main areas of your activities, then no doubt that it is time for you to know a thing or two about this platform. If this is not the case, but you are still interested, go ahead and give it a try, but I wouldn’t advise to use it in commercial operations unless there is an extreme need. At this point, for all those without specific contra-indications, it would be better to use the classic virtualization systems. This will save you a lot of nerves and money. As for our company, we are considering to start a business area to provide support for OpenStack solutions in a not-so-distant future. It looks like this is going to be fun 🙂