The Trust Problem
As part of its Technology Transfer Program, the NSA has already open-sourced 32 projects (see the full list on GitHub). Unsurprisingly, there are plenty of jokes about the NSA using these tools to spy on users. On the one hand, the code is open, and the user base is hardcore enough to audit it. On the other hand, the first bug surfaced right after Ghidra’s release.
UK infosec expert and Hacker House head Matthew Hickey noticed that in debug mode, Ghidra opens and listens on port 18001. This allows remote connections to Ghidra via JDWP (Java Debug Wire Protocol) for debugging. Hickey notes the fix is straightforward: change line 150 in support/ to bind to 127.0.0.1 instead of “*”.
More bugs keep surfacing. For example, researchers found a way to exploit an XXE if a Ghidra user opens a specially crafted project. So stay vigilant!
You can download Ghidra from the official site ghidra-sre.org, but there’s a catch: the site isn’t reachable from Russian networks (and reportedly some Canadian ones). That shouldn’t be a problem for Hacker’s readers, though. You can use any VPN, or Tor as a last resort.
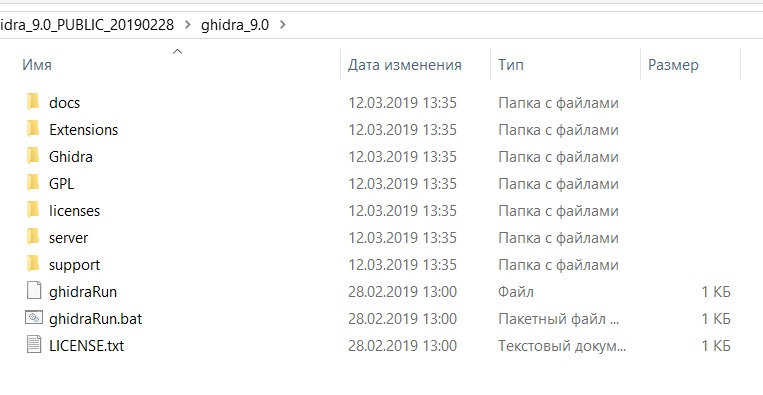
So you’ve downloaded the ghidra_9. archive and unpacked it. Let’s quickly walk through the main directories and see what’s inside.
I highly recommend checking the docs folder—it contains a lot of information about Ghidra itself, plugin development, and an overview of the key features in the form of slides and PDF documents. All the materials are, of course, in English.
Next are the license folders — nothing interesting there. The server folder contains tools for launching the remote debugging server. The support folder includes auxiliary utilities without which the program won’t run.
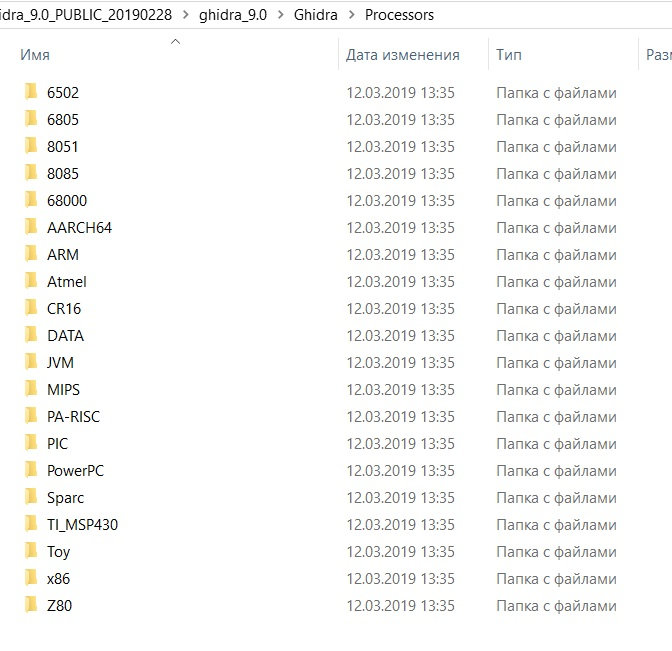
It gets more interesting in the Ghidra folder: under the ‘Processors’ directory you can browse all supported architectures. Here’s the full list: 6502, 68000, 6805, 8051, 8085, AArch64, ARM, Atmel, CR16, DATA, JVM, MIPS, PA-RISC, PIC, PowerPC, SPARC, TI_MSP430, Toy, x86, Z80.
Time to look at the application itself! To launch Ghidra on Windows, run ghidraRun.; on Linux, run ghidraRun.. The project is mostly Java, so download and install the Java Runtime Environment (JRE) if you don’t already have it.
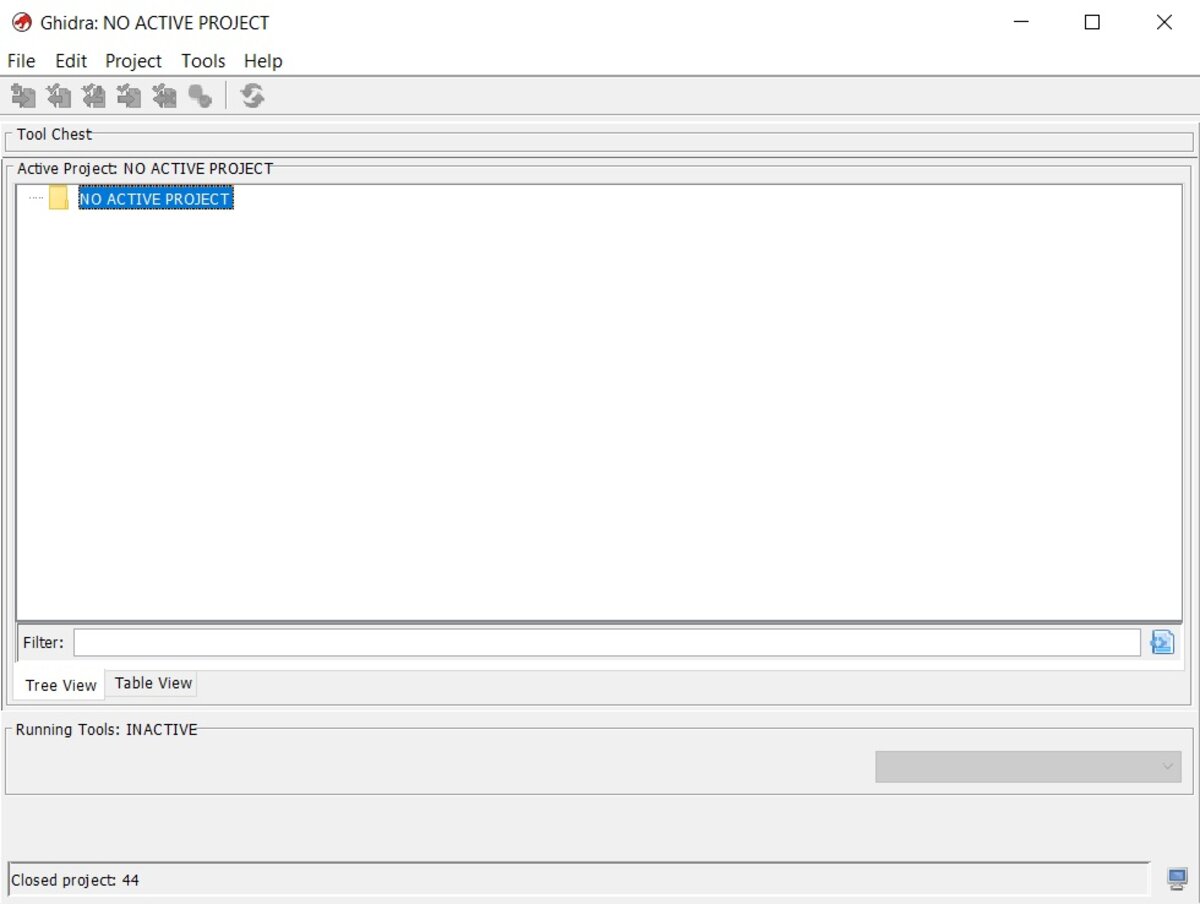
First, you’re prompted to create a project and add the binaries you want to analyze. After that, the green dragon icon becomes active—click it to launch CodeBrowser, your main working environment.
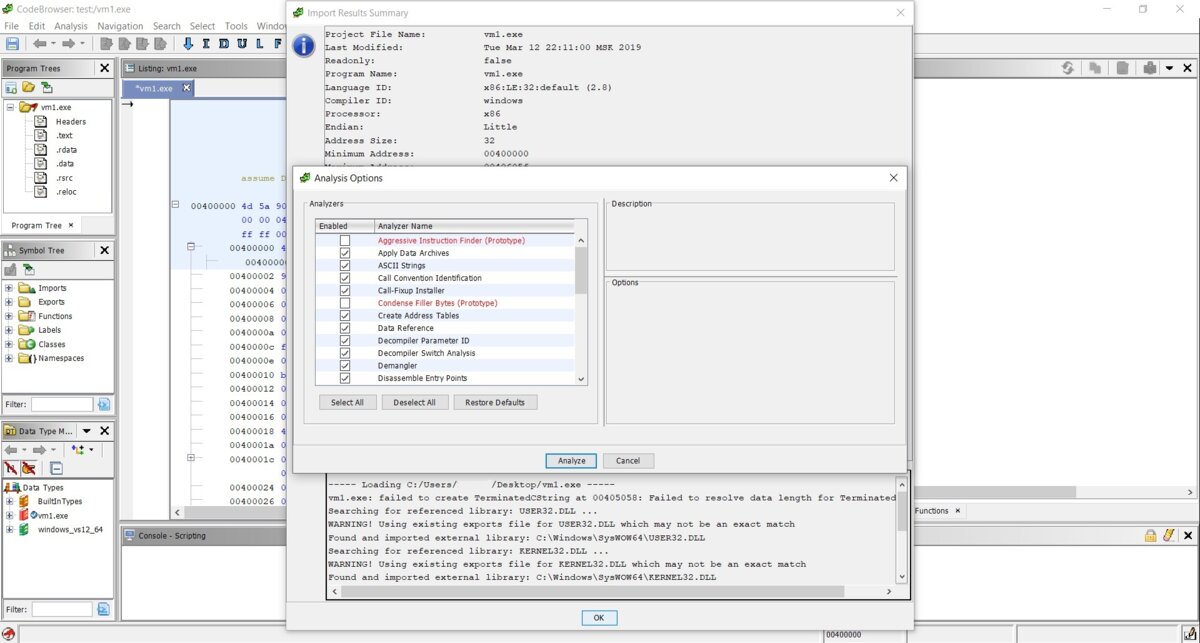
First, a window appears with technical details about the file being loaded, then a prompt to run an analysis and choose options for it. We agree. The main interface looks quite unusual—at least to me.
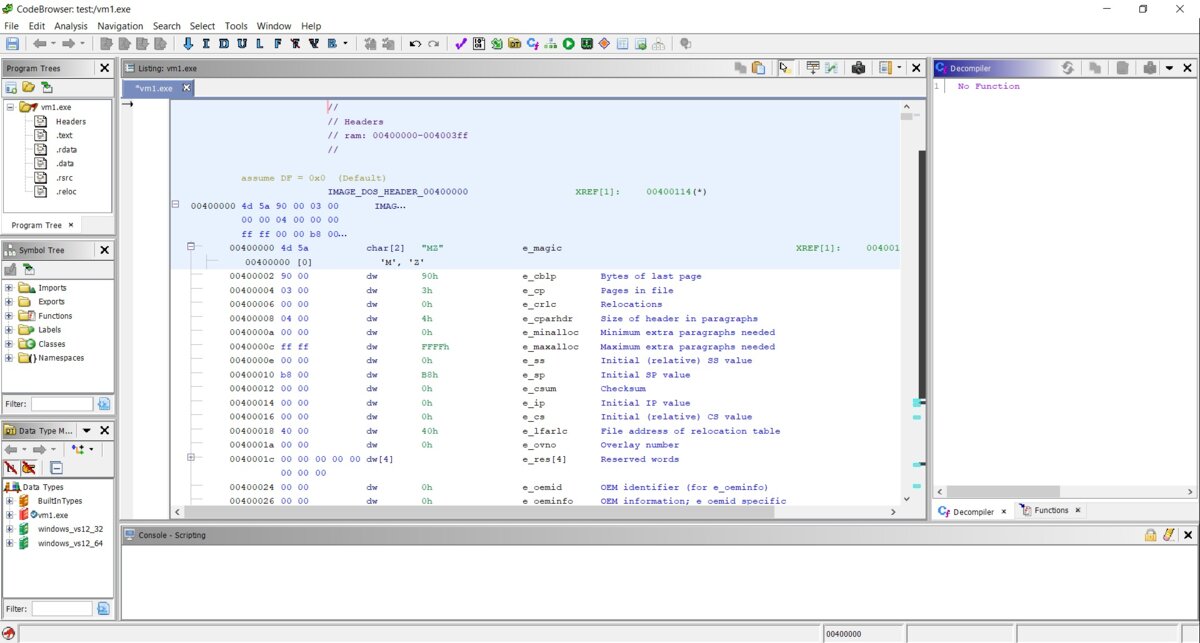
So we’ve landed in our file’s header. What we’re looking at is the IMAGE_DOS_HEADER structure, not the entry point. Interesting. I have to say all the fields are displayed correctly, and overall it looks fairly decent and informative.
info
On first launch of the app, I found the code and other fields were displayed a bit awkwardly across the disassembler windows. All of this is configurable using the Edit the listing fields button in the top-right corner of each window.
On the right, you’ll see the decompiler window—we’ll come back to it later. There’s also a Functions tab there. Go ahead and click it.
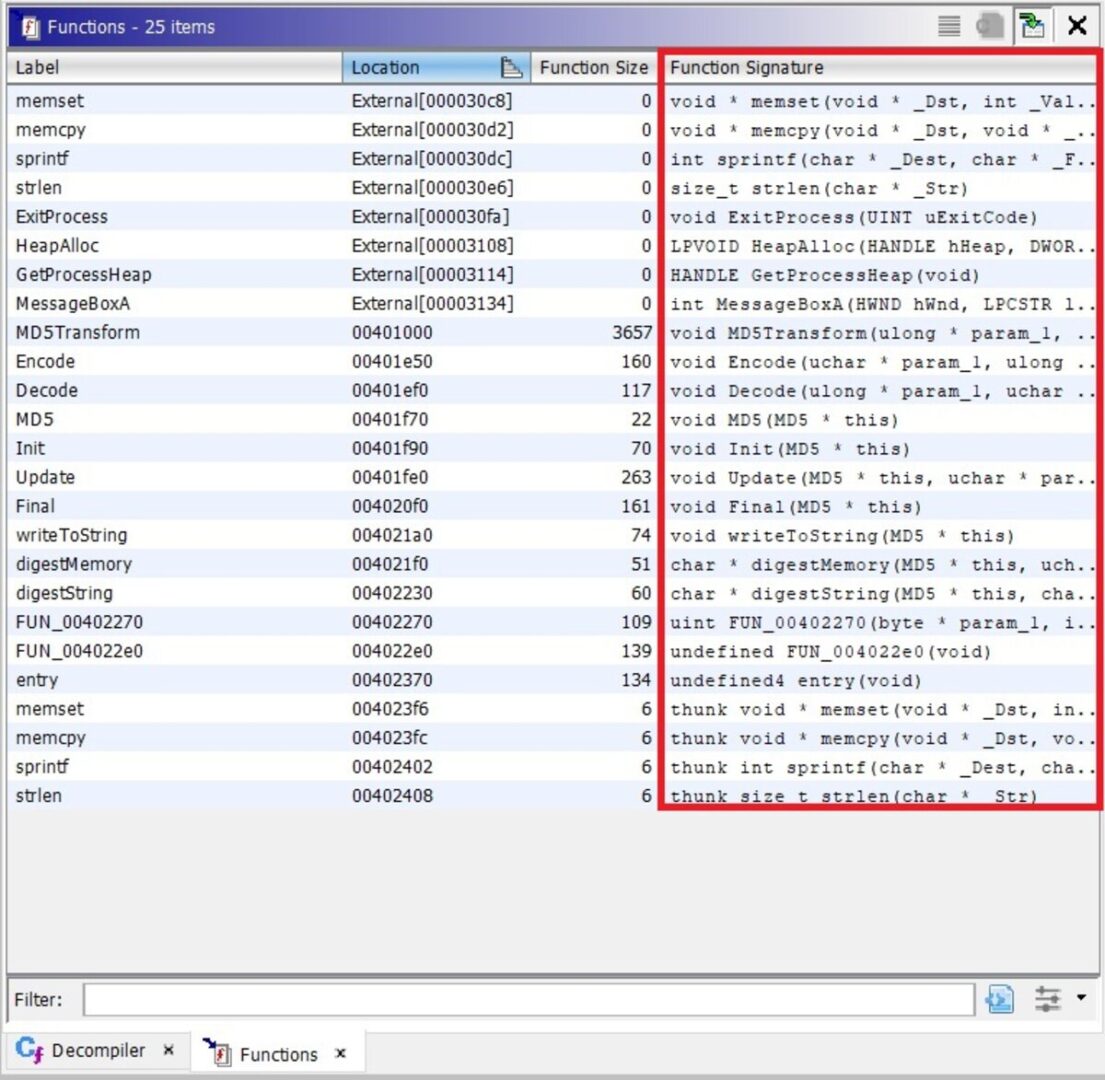
Here we can see a list of functions with their signatures—really handy, in my view. Let’s pick a function and see what happens.
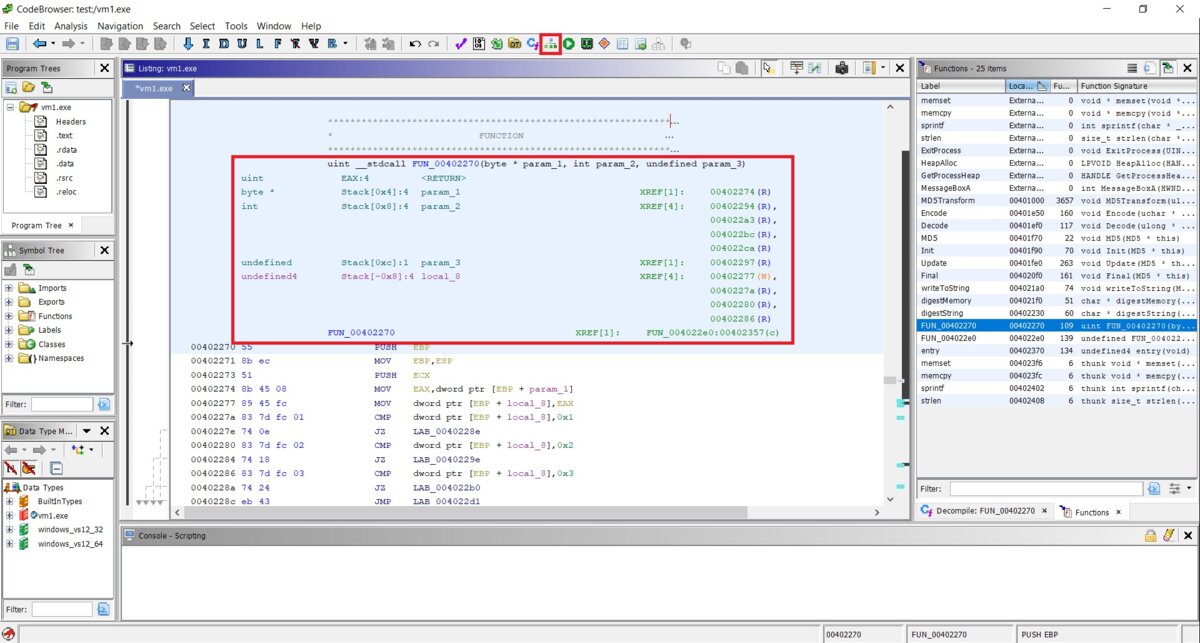
This is the entry of the function: its signature, the arguments passed in and their types, the return value, the calling convention, and the disassembly listing itself. At the very top there’s a “Display Function Graph” button—I’ve highlighted it in the screenshot. Click it.
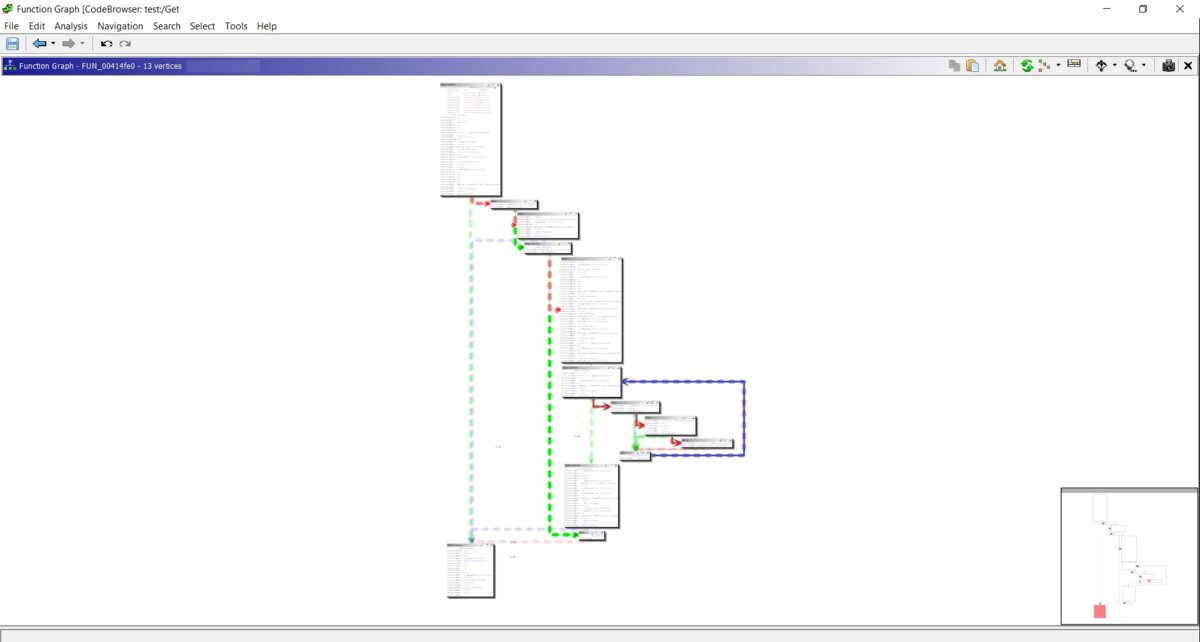

When you hover over basic blocks, there’s a playful little animation (you can see it in the screenshot). I deliberately took two screenshots of the same function: one in Ghidra’s graph view and one in IDA Pro. Maybe it’s just me, but I find Ghidra’s graph more informative. It even labels if…else constructs right in the graph. I get that this might seem a bit gimmicky, but for me Ghidra’s graphical view is both more informative and more convenient than IDA Pro’s. On top of that, the graph view is highly customizable.
Ghidra also has powerful search features—just open the Search menu to see the full list of options. For example, here’s what the string search dialog looks like.
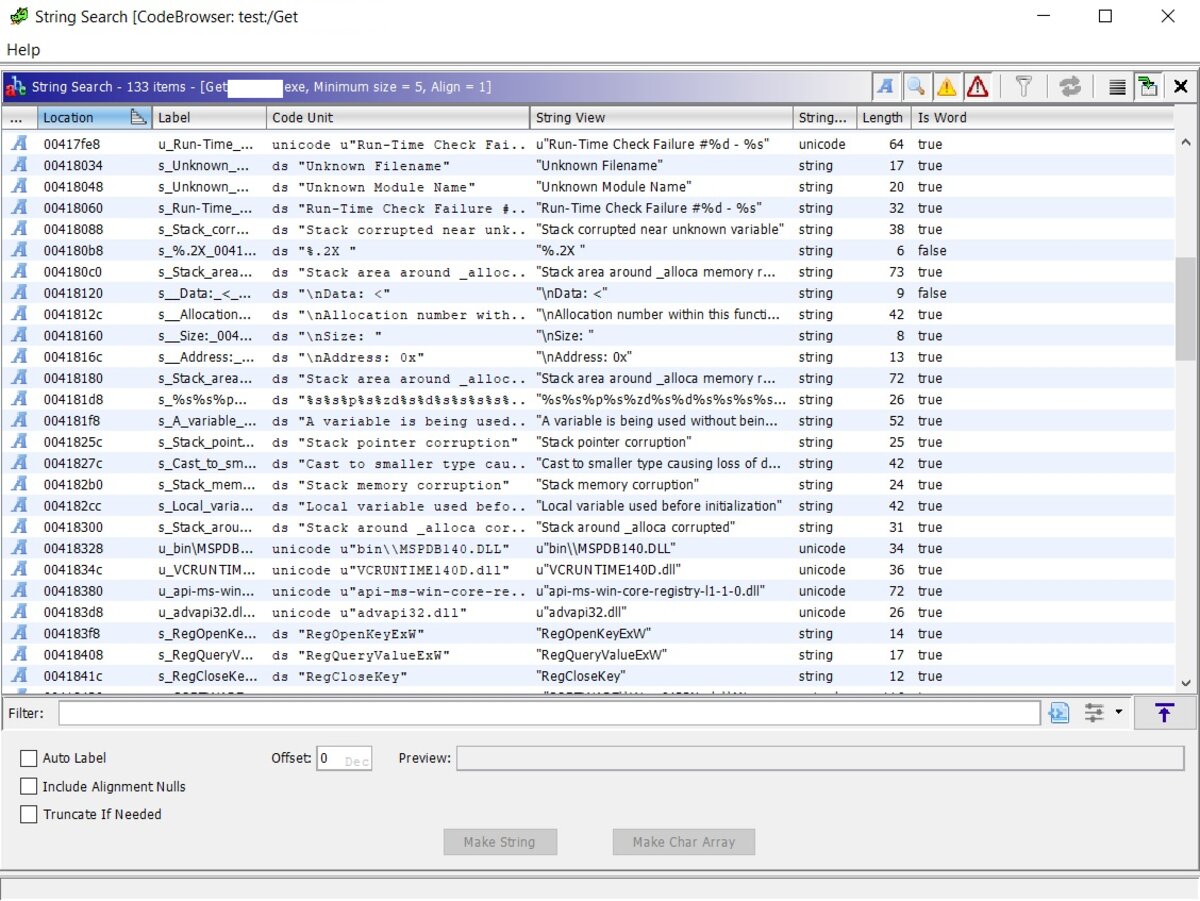
Ghidra also does an excellent job generating cross-references to just about anything—right-click, choose References in the context menu, and then pick what you need. It also shows, in the comments at the start of each function, the cross-references pointing to that function.
Ghidra has a built-in hex viewer. To access it, go to Windows → Bytes.

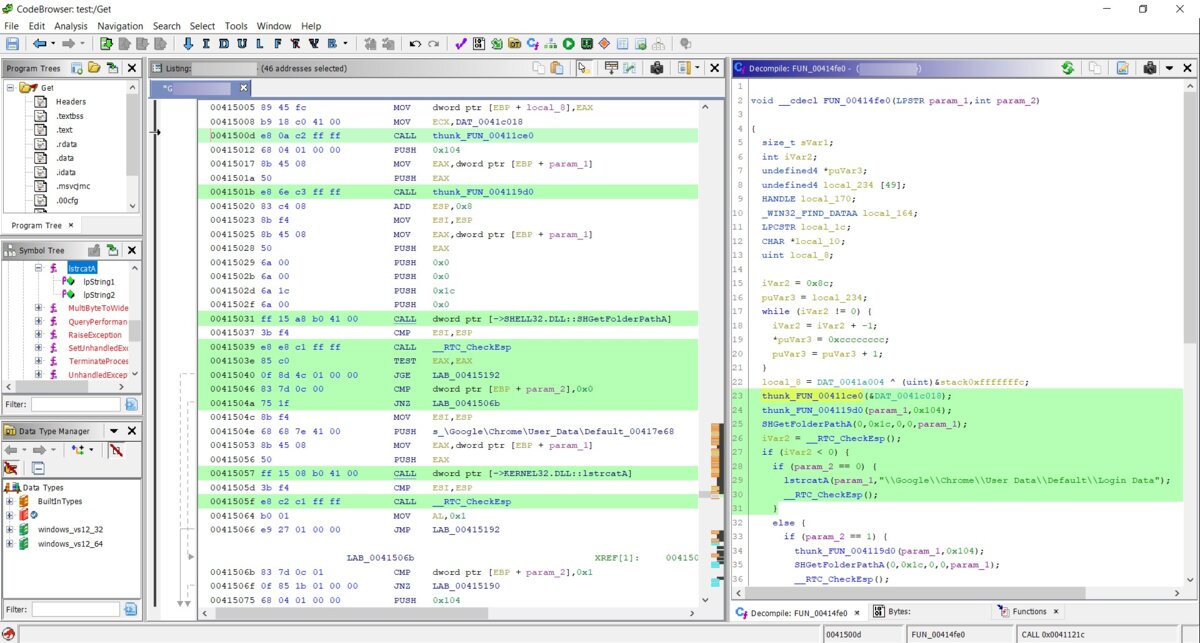
Ghidra supports patching assembly code out of the box. To use this feature, select a line of code and press Ctrl , or choose the corresponding option from the context menu. There’s a neat visual touch: if you highlight some code in the decompiler window, the corresponding code is automatically highlighted in the disassembly listing.
Another handy Ghidra feature is the Script Manager—a built‑in collection of scripts for just about everything. If there’s a script you need that isn’t included, you can add your own. All scripts are written in Java. To give you an idea of what I mean, here’s the full listing of the CreateExportFileForDll. script. The name pretty much says what it does! 🙂
import generic.jar.ResourceFile;
import ghidra.app.script.GhidraScript;
import ghidra.app.util.opinion.LibraryLookupTable;
public class CreateExportFileForDLL extends GhidraScript {
  @Override
  public void run() throws Exception {
    // Push this .dll into the location of the system .exports files.
    // Must have write permissions.
    ResourceFile file = LibraryLookupTable.createFile(currentProgram, false, true, monitor);
    println("Created .exports file : " + file.getAbsolutePath());
  }
}
You can edit scripts in the built-in lightweight editor, or open them in the Eclipse IDE directly from the context menu. Naturally, Eclipse must be installed.
On top of that, there are plenty of handy extras: a built-in diffing tool, the ability to patch code without any additional plugins, an entropy viewer, and a call-tree/trace builder. It also ships with an embedded Python interpreter (no separate installation required, unlike IDA), along with other nice touches.
Now let’s look at the decompiler, which comes built in rather than as a separate plugin like in IDA. I’ll first show the output from Ghidra’s decompiler, and then from IDA Pro.
Here is the Ghidra listing:
undefined8 FUN_1400010b0(void)
{
ushort uVar1;
longlong *plVar2;
LPCSTR lpMultiByteStr;
ushort *puVar3;
longlong *plVar4;
longlong in_GS_OFFSET;
ushort local_d8 [104];
plVar2 = *(longlong **)(*(longlong *)(*(longlong *)(in_GS_OFFSET + 0x60) + 0x18) + 0x18);
lpMultiByteStr = FUN_140001448(&DAT_140003000);
MultiByteToWideChar(0,1,lpMultiByteStr,-1,(LPWSTR)local_d8,100);
plVar4 = plVar2;
do {
plVar4 = (longlong *)*plVar4;
if (plVar4[6] != 0) {
  puVar3 = local_d8;
  while( true ) {
    uVar1 = *(ushort *)((plVar4[0xc] - (longlong)local_d8) + (longlong)puVar3);
    if ((uVar1 == 0) && (*puVar3 == 0)) goto LAB_140001140;
    if ((uVar1 < *puVar3) || (uVar1 >= *puVar3 && uVar1 != *puVar3)) break;
    puVar3 = puVar3 + 1;
  }
}
} while (plVar2 != plVar4);
LAB_140001140:
return plVar4[6];
}
And here is the IDA Pro Hex-Rays decompiler listing:
__int64 sub_1400010B0()
{
unsigned __int64 v0; // rax
_QWORD *v1; // rdi
_QWORD *v2; // rbx
const CHAR *v3; // rax
WCHAR *i; // rax
WCHAR v5; // cx
WCHAR WideCharStr; // [rsp+30h] [rbp-D8h]
v0 = __readgsqword(0x60u);
v1 = *(_QWORD **)(*(_QWORD *)(v0 + 24) + 24i64);
v2 = *(_QWORD **)(*(_QWORD *)(v0 + 24) + 24i64);
v3 = (const CHAR *)sub_140001448(&unk_140003000);
MultiByteToWideChar(0, 1u, v3, -1, &WideCharStr, 100);
while ( 1 )
{
v2 = (_QWORD *)*v2;
if ( v2[6] )
  break;
LABEL_9:
if ( v1 == v2 )
  return v2[6];
}
for ( i = &WideCharStr; ; ++i )
{
v5 = *(WCHAR *)((char *)i + v2[12] - (_QWORD)&WideCharStr);
if ( !v5 && !*i )
  break;
if ( v5 < *i || v5 > *i )
  goto LABEL_9;
}
return v2[6];
}
Personally, I find Ghidra’s decompiler output easier to read. Yes, I know Hex-Rays can be configured very flexibly. There’s also the HexRaysPyTools plugin that can improve the result further. But we’re talking about what you get out of the box—and Hex-Rays is a paid add-on.
One way or another, Ghidra’s decompiler is powerful and can definitely compete with Hex-Rays. If you go to \Ghidra\Processors, pick any architecture, and then open \data\languages, you’ll see files with extensions like *.slaspec and *.pspec, among others. Looking at them, you realize that adding support for your own architecture is entirely feasible. Yes—IDA Pro really lacks that level of openness.
Conclusion
So, we’ve taken a look at the Ghidra reverse-engineering framework. Can it replace IDA Pro? At this stage, I’d say no. Using Java for a tool like this, in my view, isn’t the best choice—mainly because of performance.
The disassembler isn’t particularly fast, especially on hefty binaries. In fact, reverse-engineering files larger than 150 MB in Ghidra can be quite a slog. On the other hand, Ghidra is cross-platform, which may matter to some.
Another point is the number of supported architectures and file loaders: IDA Pro has far more. It also lacks the same level of tight debugger integration you get with IDA Pro. On the plus side, if the NSA keeps its promise and the code is opened up, that’s great—and the ability to add support for new architectures is a genuinely compelling feature. But getting all that implemented (and the bugs ironed out) will take years.
Overall, I’ve got a strong feeling that Ghidra isn’t a finished product. In its current state, this framework feels more like a public beta than something worthy of a version 9 label. By the way, the archive name includes the word “PUBLIC,” which strongly suggests there’s also a “PRIVATE” build somewhere.
Ghidra definitely has its strengths, and in some areas it already outperforms IDA Pro, but for now it still has more weak spots. That said, the IDA team could borrow a few ideas from the new tool. For example, I like how much more informative the code graph view is. The graph layout itself is also tighter and more orderly. It supports instruction patching out of the box—no extra plugins, and no split between x64 and x86. Why keep two desktop shortcuts when one is enough? In short, Ilfak still has room to improve! 🙂
