Boris Razor & Alex Mess
The everlasting battle between creators of viruses and developers of antivirus programs is a battle of technologies: new offensive techniques appear immediately after the invention of new protection mechanisms. Therefore, many malicious programs first of all check whether they are running on a virtual machine or in a sandbox. If the malware concludes that it is running not on a real PC, it quits.
One of the techniques enabling malicious programs to evade sandboxes is called Sandbox Evasion. It is used by many cyber groups, including PlugX and Cozy Bear (APT29). For instance, the notorious Anunak group (authors of Carbanak Trojan) used a special image embedded in the document: the payload was activated only after double-clicking on this image.
We will use PowerShell and WMI to explain how can malicious programs detect virtual environments.
How to build a sandbox
The traditional adversary of any virus is a specially configured virtual machine where the researcher runs suspicious software. In many cases, IT specialists use sophisticated automated systems to analyze objects in the isolated environment with minimum human involvement. Such programs and hardware-software systems are offered by many companies, including FireEye (Network/Email Security), McAfee (Advanced Threat Defense), Palo Alto (Wildfire), Check Point (SandBlast), Kaspersky (Anti-Targeted Attack Platform), and Group-IB (TDS). Open-source products (e.g. Cuckoo Sandbox) are available as well.
It’s safe to say that almost all leading information security companies use sandbox technologies.
Let’s see how a virtual machine (VM) is operating. First of all, note that the VM is completely abstracted from the hardware component. This thesis helps to understand the origin of some techniques used to detect isolated environments.
The heart of any VM is its hypervisor, i.e. a minimalist operating system (a microkernel or nanokernel). The hypervisor provides virtual machine services to operating systems running under its control by virtualizing or emulating real (physical) hardware. The hypervisor also manages these VMs by allocating and releasing machine resources to them.
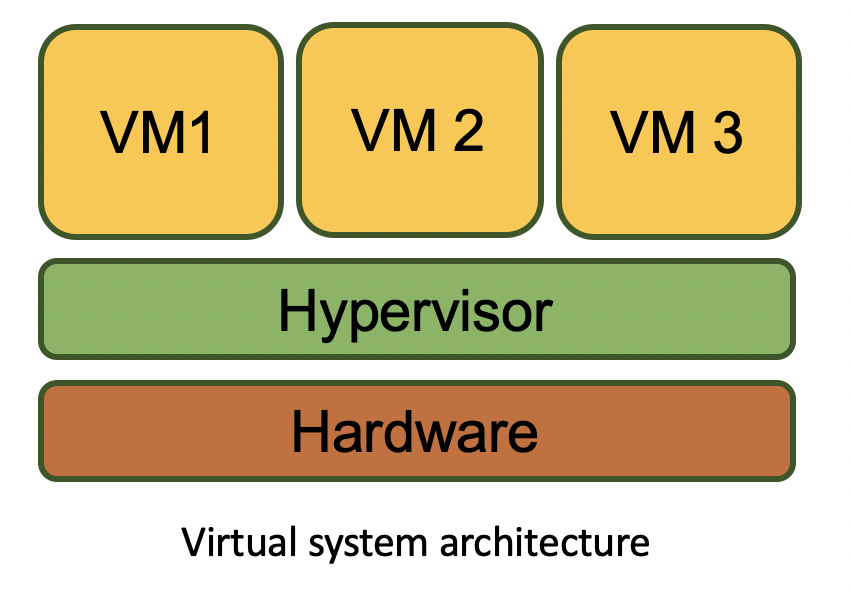
VMs have a number of specific features. First, the central processor of a hypervisor is never virtualized; instead, it distributes its resources between VMs. In other words, the hypervisor cannot allocate a half of the kernel to a VM. Second, virtualized hardware components are, in fact, files and don’t possess physical characteristics of an HDD (such as deterioration of disk sectors and other SMART parameters) or other elements of a PC.
Normally, VMs are deployed in ‘clear’ sandboxes (i.e. having no specialized malware detection tools). The analysis is performed by the hypervisor (as opposed to ‘manual’ research laboratories where programs tracking malware activities (e.g. OllyDbg, IDA, Wireshark, RegShot, Mon, Ripper, Process Monitor/Explorer, etc.) are installed on test VMs). The above programs circumvent protection modules embedded in viruses and their attempts to detect the presence of a virtual environment by editing the disassembled virus code. Below is a commercial sandbox scheme (source: the product patent). We have deliberately omitted the manufacturer’s name because it does not really matter: we are primarily interested in the idea and approach to the problem.
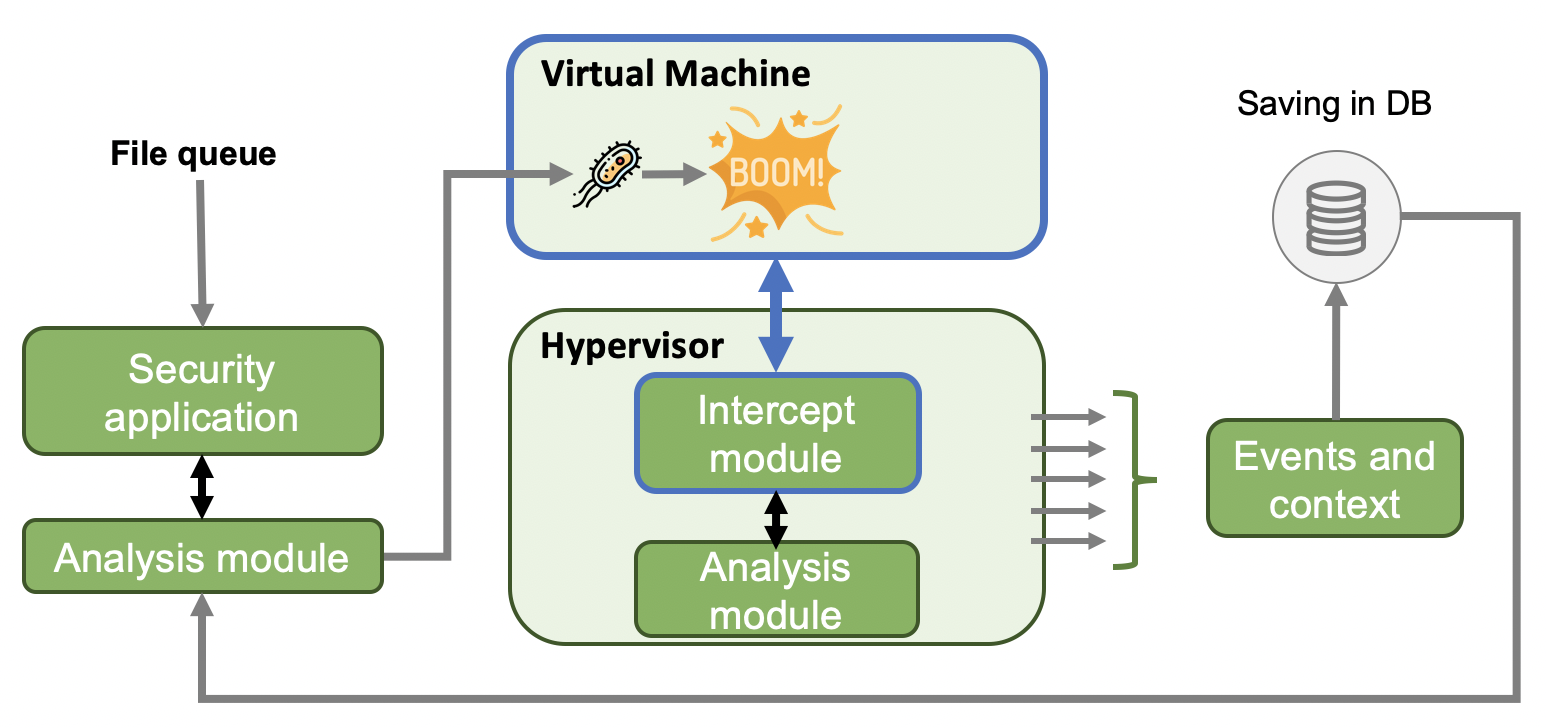
The majority of commercial dynamic analysis systems use similar schemes. Their general algorithm is as follows:
- Files submitted for analysis are queued for scanning.
- The application responsible for security and the analyzer perform preliminary operations: signature, heuristic, and other checks (because the examination of an object in a VM is a very time- and resource-consuming procedure). Ultimately, the application decides whether the sample should be sent to a sandbox for in-depth analysis, determines the parameters of the VM required for this analysis (including the OS version and bitness), and identifies the analysis methods.
- The suspicious program is placed in the VM and executed. The VM has no special software, only a standard set of programs used by an ordinary office worker in a typical company, as well as Internet access (to detect network activities of the potential malware).
- All actions performed by the examined program inside the VM are submitted to the analyzer via the hypervisor. The analyzer determines whether something malicious is happening or not based on the behavior patterns embedded into it.
- The analysis context and results are recorded in the database for storage, further use, and training of the analyzer. So, the main feature of automated analyzers is that they operate outside the virtual machine environment (i.e. on the hypervisor side) and analyze all information received by it. Accordingly, it makes no sense for a malicious program to search for specialized analysis tools on the VM side (although this aspect will also be examined in the article for better understanding of the topic).
Normally, sandboxes use KVM-based open-source and commercial hypervisors. Both types of hypervisors have their advantages and disadvantages (see the table below).
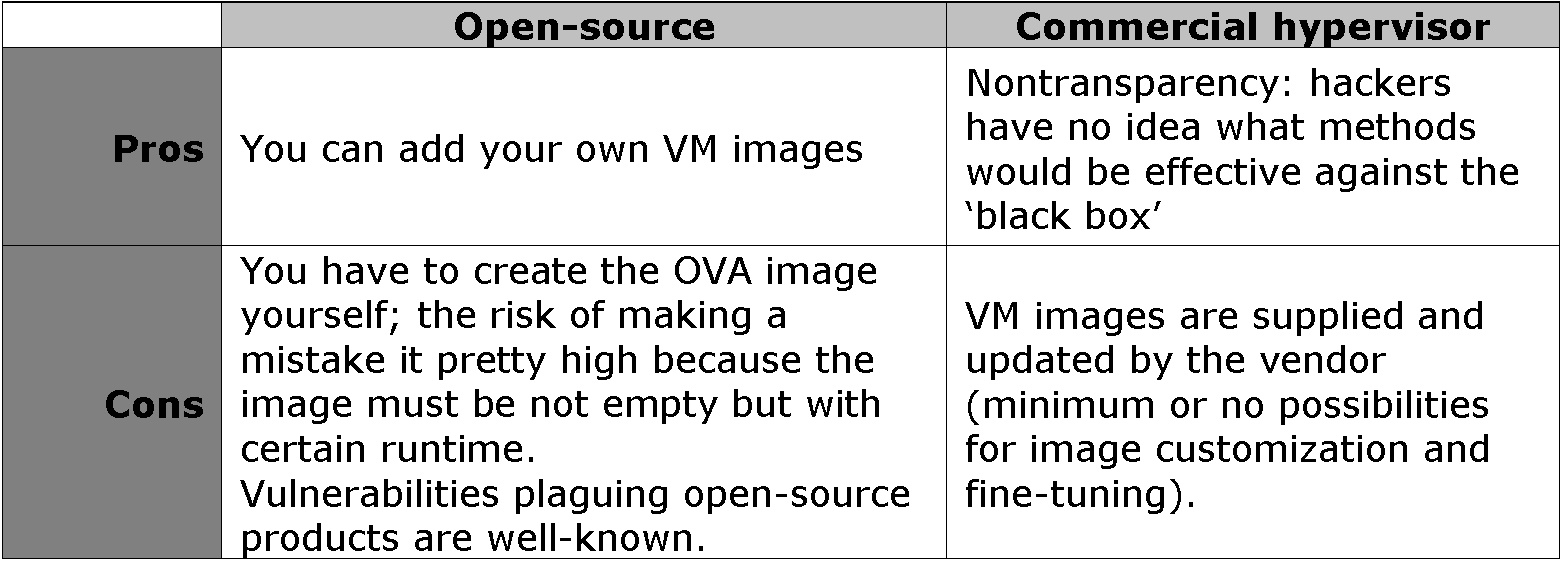
Many open-source hypervisors use a technique called hardening to conceal the fact that the suspicious program is running in a virtual environment: some of the system parameters that can be identified by the tested software (e.g. device manufacturers) are forwarded to the VM or substituted by specially generated data.
When a program is examined in the sandbox, researchers emulate various user’s actions (mouse movements, opening applications, browsing the Internet, etc.). They also assign admin rights to the tested program to monitor its behavior and change time settings to identify specific activation conditions for the malicious component (sometimes it’s activated after a certain ‘dormant’ period) and logic bombs.
Detection of sandbox environments
We wrote a small program in Python using PowerShell; this program assesses how ‘real’ is the machine it’s running on. The majority of the detection methods employed in our program require only user rights; however, some of them need the admin privileges to obtain reliable results. All tests were performed on Windows-based platforms (i.e. more popular and more frequently infected ones). For the sake of simplicity, we used WMI (Windows Management Instrumentation) queries. For the sake of unification and clarity, WMI queries were run using PowerShell.
After testing some 70 machines, we have identified a number of methods making it possible to detect virtualization tools. All virtual environment identification methods were conventionally divided into four levels: from simple searches for string signs indicating virtualization to detection of system’s physical parameters that cannot be concealed on a VM.
Level 1. Characteristic string identifiers
When a program is run on a PC for the first time, it checks what kind of computer it is. If the model name (or names of manufacturers of come components) contain virt, or there are links to well-known vendors of virtualization technologies, this may indicate that the program runs on a VM.
The manufacturer and model names can be easily edited by the sandbox developer. To see these parameters, run the following WMI query in the command line:
wmic computersystem get model,manufacturerIn PowerShell, this query looks as shown below:
Get-WmiObject Win32_ComputerSystem | Select-Object -Property Model,ManufacturerBelow are four query outputs: the first three reports have been generated for VMs, while the fourth one, for a real PC
Manufacturer: innotek GmbH
Model: VirtualBox
Manufacturer: Parallels Software International Inc.
Model: Parallels Virtual Platform
Manufacturer: VMware, Inc.
Model: VMware Virtual Platform
Manufacturer: ASUSTeK Computer Inc.
Model: K53SV (a real PC)
The official hypervisor documentation may provide the list of parameters available for editing. For instance, VirtualBox allows you to change the following parameters
- DmiBIOSVendor;
- DmiBIOSVersion;
- DmiBIOSReleaseDate;
- DmiSystemVendor;
- DmiSystemProduct;
- DmiSystemVersion;
- DmiSystemSerial;
- DmiSystemFamily;
- Disk SerialNumber;
- Disk FirmwareRevision; and
- Disk ModelNumber.
info
DMI (Desktop Management Interface) is an API enabling software to collect information about the computer’s hardware.
Next, you can check the BIOS serial number. This works our pretty often because nobody cares about fine-tuning the I/O subsystem in VMs; so if you get plausible information, chances are high that this is a real PC. Try entering the below command in PowerShell or even in PowerShell ISE (note that all operations hereinafter are performed in PowerShell; so, launch the console ASAP).
Get-WMIObject Win32_BiosOn a real machine, you will see something like:
SMBIOSBIOSVersion : K53SV.320
Manufacturer : American Megatrends Inc.
Name : BIOS Date: 11/11/11 14:59:25 Ver: 04.06.03
SerialNumber : B5N0AS16677319F
Version : ASUS – 6222004
(a real PC)
On a virtual machine, the SerialNumber field shows the virtualization environment used by it:
SBIOSVersion : 6.00
Manufacturer : Phoenix Technologies LTD
Name : Default System BIOS
SerialNumber : VMware-56 4d 0c d4 94 e7 56 70-45 0e 17 fa d8 6b a4 99
Version : PhoenixBIOS 4.0 Release 6.0
If the BIOS serial number is not available or its length exceeds 25 characters (this number was established experimentally), it means that either the machine conceals its parameters or they were purposively altered.
Time to examine the list of running processes. As you remember, this technique would likely be inefficient against commercial sandboxes. Furthermore, an attempt to obtain the list of processes may raise suspicions. Still, to get a complete picture, let’s try this method.
The presence of such processes as vmtoolsd. (as well as vboxtray, vboxservice, vmacthlp, and kqemu) should immediately ring the alarm bell. The presence of utilities listed in the beginning of this article (sysinternals and wireshark.) and debugging utilities (ollydbg, x64dbg) indicates that somebody is analyzing your program. Finally, the detection of specific ‘sandbox’ processes whose implementation is isolated at the software level (e.g. sandboxierpcss and sandboxiedcomlaunch) and Sandboxie, Shade, and BufferZone programs makes the situation crystal clear: you are dealing with a VM.
To get the list of processes, enter the command:
Get-ProcessAs you can see, the above-mentioned ‘VM indicators’ are present among the running processes:
Handles NPM(K) PM(K) WS(K) VM(M) CPU(s) Id ProcessName-------
443 47 217408 201748 459 72,87 8472 AcroRd32
89 9 2744 1500 32 0,09 1784 AsLdrSrv
46 8 2668 516 56 0,09 2084 ATKOSD
98 13 5488 788 90 0,66 2384 ATKOSD2
369 13 24208 23660 67 8776 audiodg
…
91 6 1144 5228 53 1.63 944 vmacthlp
319 22 5720 17536 136 96.78 1260 vmtoolsd
327 22 4700 14360 94 149.00 1924 vmtoolsd
…
An interesting academic question: if the program detects that it’s running inside a sandbox and starts an endless loop, thus, freezing the VM, would the sandbox system be able to extract artifacts from it?
Another efficient trick is to check the name of the running program. Sometimes, malware samples analyzed in sandboxes are renamed into sample., virus., runme., artifact., etc. Alternatively, the sample gets a name equal to its checksum. Of course, sound researchers rarely rename files prior to executing them, but who knows?..
VMware offers a number of official and documented VM detection techniques. The first such technique uses hypervisor port 0x5658 (VX) and the VMWare Magic Number Check: 32-bit DWORD value (VMXh). The method is pretty old and widely used by malware creators. It can be easily disabled by reconfiguring the %vmname%. file or by using additional filtering. However, smooth operation of VMware Tools requires this backdoor to be open.
Intel and AMD CPUs have reserved bit 31 in the ECX register of the CPUID instruction as the hypervisor present bit (HV). This bit allows hypervisors to indicate their presence to the guest operating system: hypervisors set it to one, while physical CPUs (all the existing and future CPUs) set this bit to zero. Accordingly, a guest OS can check bit 31 to detect whether it is running inside a VM.
According to the official Microsoft documentation, “before it uses any hypervisor interface functions, software should first determine whether it runs within a virtualized environment. On x64 platforms, software verifies that it runs within a virtualized environment by executing the CPUID instruction with an input (EAX register) value of 1. When the CPUID instruction is executed, code should check bit 31 of register ECX. Bit 31 is the hypervisor-present bit. If the hypervisor-present bit is set, the hypervisor is present. In a non-virtualized environment, the hypervisor-present bit is clear.”
If the presence of an HV bit is confirmed, it is necessary to find out the HV type. Intel and AMD have also reserved CPUID addresses 0x40000000-0x400000FF for software use. Hypervisors can use these addresses to provide an interface to pass information from the hypervisor to the guest operating system running inside a virtual machine. The hypervisor bit indicates the presence of a hypervisor and that it is safe to test these additional software leaves. VMware defines the 0x40000000 address as the hypervisor CPUID information address. Code running on a VMware hypervisor can test the CPUID information address for the hypervisor signature. VMware stores the string VMwareVMware in the EBX, ECX, and EDX registers of the CPUID instruction.
The above-mentioned CPUID methods are used in Win32/Winwebsec malware. Source codes of such malicious programs are available online.
Similar to searches for running processes, the use of CPUID techniques by the tested program makes the sandbox suspicious. A detection technique based on processor flags was employed at earlier stages of our research; but after numerous tests, we decided to abandon this module because it compromises our software and brings numerous false-positive responses.
Overall, at Level 1, we search for characteristic features of VMs running in sandboxes, including the following strings inside the OS:
- BIOS, HDD, and CPU serial numbers;
- MAC addresses;
- names of the platform, PC, domain, processes, files, and registry keys;
- analytical utilities running on the VM (OllyDbg, Wireshark, RegShot, Mon, Ripper, Process Monitor/Explorer, etc.);
- CPUID identification; and
- altered name of the executable file.
Level 2. Interaction and system environment
At this level, we search for features indicating that the studied machine is a real workstation (i.e. not a VM whose only purpose is to analyze our program). In addition, we examine the resources allocated to the VM.
To check when the system was launched, enter the following console command:
wmic path Win32_OperatingSystem get LastBootUpTimeThe output looks as follows:
LastBootUpTime
20200505015539.735711+180
You can also use the respective PowerShell command:
Get-WmiObject win32_operatingsystem | select csname, @{LABEL='LastBootUpTime';EXPRESSION={$_.ConverttoDateTime($_.lastbootuptime)}}Its output is much more clear:
csname LastBootUpTime------
Mycomp 04.05.2020 13:50:47
If the system uptime is less than ten minutes, it was likely launched with the sole purpose to examine our software (most probably, for subsequent manual analysis) or launched from a VM image. Every time a VM is launched from the same snapshot, the uptime of its OS is the same. In many virtual machines launched in sandboxes from snapshots, uptime values are similar. On average, such values vary in the range of 2000 ± 100 s. The number of days that have passed since the last start of the machine is also important because real computers are normally turned on and off on once a day. If the machine wasn’t in use for more than a month, this is definitely suspicious. This detection method capitalizes on developers’ negligence.
If our program has the admin privileges (most sandboxes run suspicious programs with the admin privileges to give them maximum freedom of action), you can check the number of interactive logons recorded in the security logs (provided that the logging of logon attempts is enabled).
For instance, let’s review all events with EventId=7001 and EventId=7002 (logins and logouts) for the last seven days:
$logs = get-eventlog system -ComputerName yourCompName-source Microsoft-Windows-Winlogon-After (Get-Date).AddDays(-7);$res = @();ForEach ($log in $logs) {if($log.instanceid -eq 7001) {$type = "Logon"}Elseif ($log.instanceid -eq 7002){$type="Logoff"}Else {Continue}$res += New-Object PSObject-Property @{Time = $log.TimeWritten;"Event" = $type;User = (New-Object System.Security.Principal.SecurityIdentifier $Log.ReplacementStrings[1]).Translate([System.Security.Principal.NTAccount])}};$resThe output looks approximately as follows:
Event User Time-----
Logon yourCompName 02.05.2020 10:34:09
Logoff yourCompName 01.05.2020 21:58:19
Logon yourCompName 30.04.2020 17:13:53
Logoff yourCompName 29.04.2020 23:34:46
If you see that somebody was logging into the system frequently (at least, 20 times in a few months) and on a regular basis (at least, once a month), chances are high that the PC is real.
Another interesting parameter is the number of shared network folders (so-called administrative shares). Normally, Windows-based systems have four such folders: C$, D$ (provided that this volume exists), ADMIN$, and IPC$. To view them, type:
Get-WmiObject -Class win32_shareThe output displays the shares and their descriptions.
Name Path Description----
ADMIN$ C:Windows Remote Admin
C$ C: Standard shared resource
D$ D: Standard shared resource
IPC$ Remote IPC
You can also use another similar command (note that it works not with all PowerShell versions):
Get-SmbShareIf there are no shared folders or their number is two or less, the machine was likely tweaked by a skilled specialist to limit its unused network resources. This does not 100% mean that you are dealing with a VM, but still raises suspicions.
The next step is to check the hard drive and RAM sizes. It’s highly unlikely that a real machine has a hard drive less than 100 GB and less than 2 GB of RAM.
To ask a computer of its RAM, type:
$cs = get-wmiobject -class "Win32_ComputerSystem" [math]::Ceiling($cs.TotalPhysicalMemory / 1024 / 1024 / 1024)It response, it will give you a number. This is sufficient for a quick assessment, but if you want all details, use the following command:
$cs = get-wmiobject -class "Win32_ComputerSystem"$csThe detailed output clearly indicates whether you are dealing with a real PC…
Domain : WORKGROUP
Manufacturer : ASUSTeK Computer Inc.
Model : K53SV
Name : mysupuerdupercomp
PrimaryOwnerName : author
TotalPhysicalMemory : 8497418240 (8 GB RAM, a real PC)
…or with a VM:
Domain : WORKGROUP
Manufacturer : VMware, Inc.
Model : VMware Virtual Platform
Name : IE11WIN10_virtual
PrimaryOwnerName :
TotalPhysicalMemory : 1671300608 (< 2 GB RAM)
To view the available volumes, their names, and sizes, type:
Get-WmiObject -Class Win32_logicaldiskCompare the outputs generated for a real computer…
DeviceID : C:
DriveType : 3
ProviderName :
FreeSpace : 29173989376
Size : 256051458048 (256 GB – OK)
VolumeName : OS
…and for a virtual environment:
DeviceID : C:
DriveType : 3
ProviderName :
FreeSpace : 30396342272
Size : 42947571712 (42 GB only)
VolumeName : Windows 10_virtual
Another important feature indicating whether the system is real or not is the total number of USB devices ever connected to it. To count them, type:
$poo=Get-WmiObject -Class Win32_USBControllerDevice$poo.countThe output gives your the total number of connected devices. If this number is two or less, this is very suspicious. People connect to real PCs various peripherals: keyboards, mice, and flash drives. On a newly-deployed VM, the number of USB devices registered in the system normally does not exceed 15.
The types and number of network adapters can be used as indirect indicators, too. If a Wi-Fi adapter is present in the system, chances are high that this is a real PC. To view network adapters, type: Get-WmiObject .
The processor parameters constitute an essential hardware configuration element of any computer. The number of cores is important (if it’s less than two, this is suspicious) but not sufficient. It’s critical to identify the CPU model, especially if it’s on the list of preinstalled processor models in the KVM. Enter the below command in the command line of the KVM hypervisor – and you will see an output resembling the one shown below.
# kvm -cpu ?This is the list of CPU models for guest operating systems supported by the hypervisor (models that we had encountered in some sandboxes are shown in bold):
x86 qemu64 QEMU Virtual CPU version 2.4.0
x86 phenom AMD Phenom(tm) 9550 Quad-Core Processor
x86 core2duo Intel(R) Core(TM)2 Duo CPU T7700 @ 2.40GHz
x86 kvm64 Common KVM processor
x86 qemu32 QEMU Virtual CPU version 2.4.0
x86 kvm32 Common 32-bit KVM processor
x86 coreduo Genuine Intel(R) CPU T2600 @ 2.16GHz
x86 486
x86 pentium
x86 pentium2
x86 pentium3
x86 athlon QEMU Virtual CPU version 2.4.0
x86 n270 Intel(R) Atom(TM) CPU N270 @ 1.60GHz
x86 Conroe Intel Celeron_4x0 (Conroe/Merom Class Core 2)
x86 Penryn Intel Core 2 Duo P9xxx (Penryn Class Core 2)
x86 Nehalem Intel Core i7 9xx (Nehalem Class Core i7)
x86 Westmere Westmere E56xx/L56xx/X56xx (Nehalem-C)
x86 SandyBridge Intel Xeon E312xx (Sandy Bridge)
x86 IvyBridge Intel Xeon E3-12xx v2 (Ivy Bridge)
x86 Haswell-noTSX Intel Core Processor (Haswell, no TSX)
x86 Haswell Intel Core Processor (Haswell)
x86 Broadwell-noTSX Intel Core Processor (Broadwell, no TSX)
x86 Broadwell Intel Core Processor (Broadwell)
x86 Opteron_G1 AMD Opteron 240 (Gen 1 Class Opteron)
x86 Opteron_G2 AMD Opteron 22xx (Gen 2 Class Opteron)
x86 Opteron_G3 AMD Opteron 23xx (Gen 3 Class Opteron)
x86 Opteron_G4 AMD Opteron 62xx class CPU
x86 Opteron_G5 AMD Opteron 63xx class CPU
x86 host KVM processor with all supported host features (only available in KVM mode)
It’s funny, but in some dynamic analysis systems, you may notice inconsistencies between various physical components (e.g. the motherboard and processor have different chipsets, or the number of cores in a specific CPU model is incorrect).
It is critical to find out whether antivirus products are installed in the system (antiviruses were noted in some sandboxes and VMs running in them). It’s also great to check whether their signature bases are actual (the productState field; see detailed explanations of all values here). To run such a query, type:
Get-WmiObject -Namespace "rootSecurityCenter2"-Class AntiVirusProduct -ComputerName yourCompNameThe command output provides required details (we left only the key fields here). Not all programs may be displayed clearly, but at least, now you know where to look for them:
__GENUS : 2
__CLASS : AntiVirusProduct
__SUPERCLASS :
__DYNASTY : AntiVirusProduct
…
displayName : Trend Micro Titanium Internet
…
pathToSignedProductExe : C:Program FilesTrend MicroTitaniumwschandler.exe
pathToSignedReportingExe : C:Program FilesTrend MicroUniClientUiFrmwrkWSCStatusController.exe
productState : 266240
In addition, a few sophisticated tricks make it possible to check whether the PC is virtual or not. For instance, you can request the mouse pointer location or a regular basis. If the malware analysis is performed without the imitation of user activities, the mouse pointer won’t move most of the time. An article published by Kaspersky Lab explains why it’s important to model mouse movements and button clicks in a sandbox.
Another trick involves the connection to the browser database and analysis of the browsing history, logins, and passwords. This can be done with a special Python module called browserhistory.
Overall, at Level 2, we identify the basic hardware characteristics of a VM and how elaborated and interactive it is. The following parameters are examined:
- HDD, RAM, and video RAM sizes (see also Level 4 for more detail on the video RAM and some other parameters) and the number of CPU cores;
- the last boot-up, uptime, Windows logs (e.g. the number of interactive logins with
EventID); in addition, you can use WMI to check the OS installation date (== 4624 $system);= Get-WmiObject -Class Win32_OperatingSystem $system. Installdate - mouse movements;
- browsing history; and
- monitor resolution, presence of a cooler in the system, connected printers, battery (an easy way to detect real laptops: virtual machines are never run on a server powered by a battery, right? To check for the battery, use the command
Get-WmiObject), Wi-Fi adapter, etc.Win32_Battery
Level 3. Time delays
At this level, we analyze the software execution time and monitor the dynamically changing time assuming that dynamic analysis tools delay the program execution.
In the simplest case, you need to record the program start time (the local time of the system and the time on an external NTP server are taken for comparison). As the program starts, you start your own time count (e.g. the number of processor cycles) in order to compare the total runtime of the program. The formula is simple:
operation/function/module finish time – start time = amount of time on the internal counter
If the date or time has changed (a clear sign that the program is running in a sandbox), you will immediately notice this; in such a situation, the best option for your program is to jump to a nonmalicious piece of code and execute it. Below is a time delay report for software running in a sandbox.
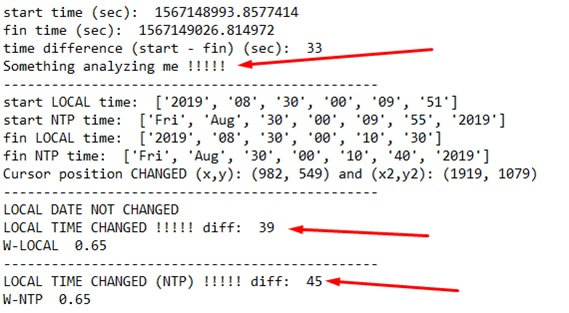
The screenshot indicates that the local time and the network time have changed in the dynamic analysis system by different numbers of seconds. The program execution time was 33 s, while the local time increased by 6 s, and the NTP time, by 13 s.
Interestingly, while testing an early version of our Python program, we have submitted the executable file to VirusTotal for analysis. A few days later, we received a report from Canada where the program was tested.
FTP server log
103.208.85.223 UNKNOWN wrtftpuser [03/Apr/2017:17:26:07 +0000] “STOR file03042020_223856.txt” 226 1025
BORROS-PC.lan UNKNOWN ftpuzer [03/Apr/2017:17:29:34 +0000] “RETR file03042020_223856.txt” 226 1025
Fragment of the report
Is Admin? > 1
System uptime of 113 seconds
UPTIME LESS THAN 10 MIN !!!!!
total log in: 9777
machine most likely REAL (more than 15 log in)
CAN’T GET VALUE OF HDD TEMPERATURE SENSOR
CAN’T GET VALUE OF CPU TEMPERATURE SENSOR-----------------------------------------------
start time: 6.07619124777e-06
fin time: 59.5664095576
time difference (start – fin): 59.5664034814
TIME_DELAY: 60-----------------------------------------------
start LOCAL time: [‘2017′, ’04’, ’03’, ’22’, ’37’, ’50’]
start NTP time: [‘Mon’, ‘Apr’, ’03’, ’22’, ’55’, ’01’, ‘2017’]
fin LOCAL time: [‘2017′, ’04’, ’03’, ’22’, ’38’, ’53’]
fin NTP time: [‘Mon’, ‘Apr’, ’03’, ’22’, ’56’, ’04’, ‘2017’]-----------------------------------------------
LOCAL DATE NOT CHANGED
LOCAL TIME NOT CHANGED
LOCAL TIME NOT CHANGED (NTP)-----------------------------------------------
W_CpuID 1 W_HDD_CPU_TEMP 1.4 W_VMware 1 W_UPTIME 0.2 (weighted coefficients for various checks)===============================================
W_TOTAL → 0.9 (probability of a virtual machine)===============================================
Normally, the program execution takes up to 20 s; however, in this case, it took 60 s, which clearly indicates that analytical tools were applied to the executable file. In addition, a review of the system log revealed 9777 interactive logins. The program was launched with the admin privileges, while the system itself has started only 113 seconds ago. Everything indicates that a manual sample check involving inter alia the CPUID method was performed.
In other words, a virtual machine was launched to test samples of supposedly malicious software. As recently as in 2017, VirusTotal had used its own dynamic scan for tested objects, but not anymore… The temperature sensors mentioned in the report will be discussed in detail in the chapter describing Level 4.
Level 4. Hardware parameters (yes, it’s about physics, baby!)
The most reliable sign that you are dealing with a real PC (i.e. not a VM) is the possibility to reach to its hardware. Developers seeking to harden their sandbox may accidentally set a processor name that doesn’t match its architecture. A similar problem often occurs with other parameters that are not fully transferred to the virtual environment, or are hidden, or simply cannot be forwarded to a VM. If a system has only one core, it’s definitely not a modern computer but rather an old system block, or laptop, or tablet, or VM.
WMI has a special class for such processor-related queries:
Get-WmiObject -Class Win32_ProcessorIt displays detailed information on the processor:
…
Caption : Intel64 Family 6 Model 42 Stepping 7
…
Description : Intel64 Family 6 Model 42 Stepping 7
…
L2CacheSize : 256 (L2 cache size)
L2CacheSpeed :
L3CacheSize : 6144 (L3 cache size)
L3CacheSpeed : 0
…
Manufacturer : GenuineIntel
…
Name : Intel(R) Core(TM) i7-2630QM CPU @ 2.00GHz
NumberOfCores : 4
NumberOfLogicalProcessors : 8
…
ProcessorId : BFEBFBFF000206A7
…
Note the L2 and L3 cache sizes on a real PC. Compare them with the cache sizes on VMs:
Vbox:
L2CacheSize: None
L3CacheSize: 0
VMware:
L2CacheSize: 0
L3CacheSize: 0
Paralles:
L2CacheSize: None
L3CacheSize: 0
What the heck… Why L2 and L3 caches are null in a VM? We thoroughly researched this issue at early development stages. Look at the scheme below.
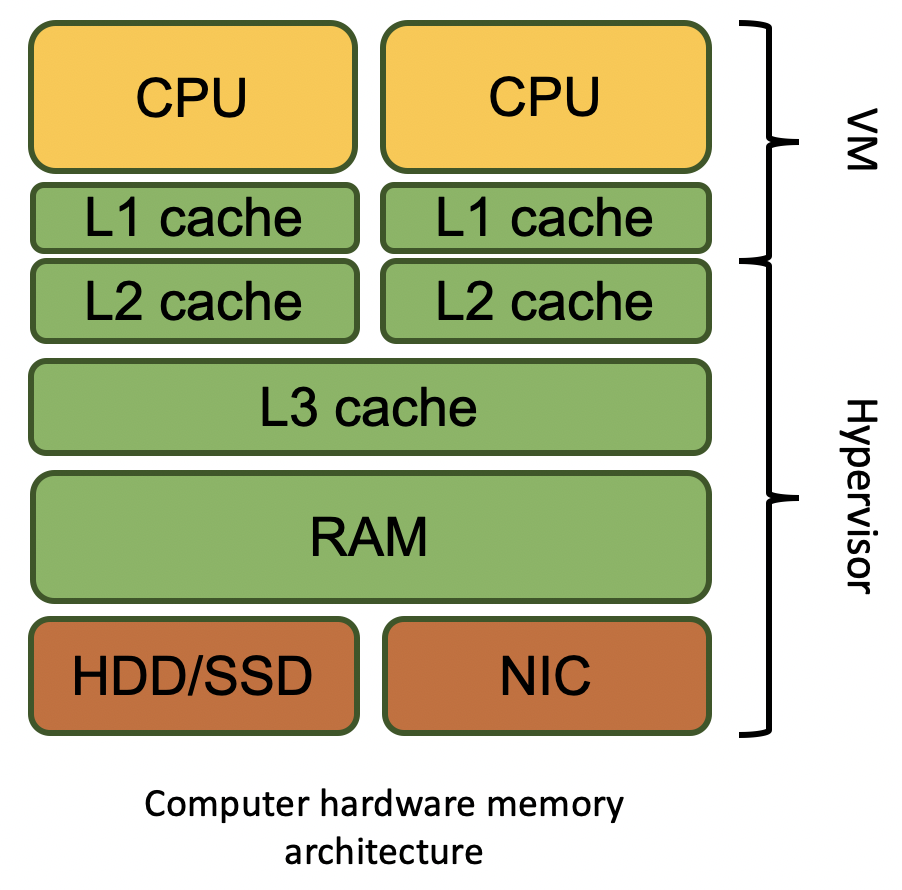
Processors have instruction and data caches (constituting two sublevels of the L1 cache). The instruction cache (L1i) is used to read instructions of the executed program. The processor and L1 cache constitute the minimum required for an OS and programs to run on hardware and on a VM.
The L2 cache is used for large data arrays; by default, it’s located in the hypervisor. However, if the hypervisor is used to configure a more powerful VM, this cache would likely be forwarded to the VM.
The L3 cache is a cache layer located above the main memory. Accordingly, the L3 cache is used by all processors installed on the motherboard. Every time the CPU requests data from the main memory, a larger data array is written to the L3 cache. If the CPU needs even more data to be sequentially saved after the memory requested earlier, chances are high that the memory can be found in the L3 cache located on the hypervisor side.
Still, some CPU parameters can be forwarded to a virtual machine or substituted, including Caption, DeviceID, Manufacturer, MaxClockSpeed, Name, and SocketDesignation.
As a result, the hypervisor provides the L1 cache to the VM, but it’s sometimes impossible to reach to the L2 cache from the virtual machine, while the L3 cache cannot be reached in almost all cases. Therefore, if the cache sizes are zero or none (the value cannot be obtained), you are most probably dealing with a VM.
www
More information on hardware virtualization can be found in an article available on the Vmware website.
Some sandbox vendors have already fixed the ‘missing cooler’ bug, or, alternatively, their programs closely monitor checks for its existence – even though real computers often process such requests incorrectly. To get information on the coolers, use the following PowerShell script:
$colItems = Get-WmiObject Win32_Fan -Namespace "rootcimv2"foreach ($objItem in $colItems){ "Active Cooling: " + $objItem.ActiveCooling "Availability: " + $objItem.Availability "Device ID: " + $objItem.DeviceID "Name: " + $objItem.Name "Status Information: " + $objItem.StatusInfo}If a cooler was detected, the script output should look something like this:
Active Cooling : True
Availability : 3
Device ID : rootcimv2 1
Name : Cooling Device
Status Information : 2
A good idea is to check the machine for available audio devices (the Win32_SoundDevice class). On simple VMs, such requests normally bring no response. Also don’t forget to check for available printers using the Win32_Printer class. If the system has registered printers in use (aside from the default ones), you are likely dealing with a real computer.
The below parameters relate to the video controller and screen:
- screen resolution;
- number and type of video controllers; and
- video memory size.
To request the screen resolution, type:
Get-WmiObject -Class Win32_DesktopMonitor |Select-Object ScreenWidth,ScreenHeightOn a real computer, it will be displayed without any problem:
ScreenWidth ScreenHeight-----------
1366 768
On a VM, these fields will be empty or will show a low resolution. What about video controllers?
Get-WmiObject -Class Win32_VideoControllerOn a real laptop, there are two controllers: an integrated and a discrete ones:
AdapterCompatibility : NVIDIA
AdapterDACType : Integrated RAMDAC
AdapterRAM : 1073741824
Caption : NVIDIA GeForce GT 540M
VideoProcessor : GeForce GT 540M
AdapterCompatibility : Intel Corporation
AdapterDACType : Internal
AdapterRAM : 2210398208
Caption : Intel(R) HD Graphics 3000
VideoModeDescription : 1366 x 768 x 4294967296 colors
VideoProcessor : Intel(R) HD Graphics Family
Compare it with the output of the same script run on a VM from the Virtual Desktop Infrastructure (only the key strings are displayed):
AdapterCompatibility : Citrix Systems Inc.
AdapterDACType : Virtual RAMDAC
AdapterRAM : 0
Caption : Citrix Display Only Adapter
VideoModeDescription : Colors: 1440 x 900 x 4294967296
VideoProcessor : Citrix Virtual Display Adapter Chip
AdapterCompatibility : Citrix Systems Inc.
*AdapterDACType : *
*AdapterRAM : *
Caption : Citrix Indirect Display Adapter
*VideoModeDescription : *
VideoProcessor :
AdapterCompatibility : VMware, Inc.
AdapterDACType : n/a
AdapterRAM : 0
Caption : VMware SVGA 3D
VideoModeDescription : Colors: 1440 x 900 x 4294967296
VideoProcessor : VMware Virtual SVGA 3D Graphics Adapter
If you want to see the video memory size in a meaningful format, use the following PowerShell command:
Get-WmiObject Win32_VideoController |select name, AdapterRAM,@{Expression={$_.adapterram/1MB};label="MB"}Now the video memory size is provided in megabytes:
name AdapterRAM MB----
NVIDIA GeForce GT 540M 1073741824 1024
Intel(R) HD Graphics 3000 2210398208 2108
For some mysterious reason, the video memory size on a VM is either null, or cannot be obtained, or is very small.
On VMs you are either unable to get the screen resolution, or it’s weird (e.g. 800×600). The same applies to the number of video controllers. If the AdapterDACType (Digital-to-Analog Converter) parameter does not contain strings like Internal or Integrated in its name or is empty, this is very suspicious. Small amounts of video memory (e.g. less than 256 MB) are suspicious as well (in our case, size does matter!). The impossibility to get the value of this parameter is typical for virtual environments.
The situation with Citrix-based virtual video controllers and other devices with VDI is pretty interesting: their video memory size is zero, but such devices can be filtered by vendor name. In addition, a virtual video adapter cannot be the only adapter in the system: there must be another one: either Internal or Integrated.
Plenty of interesting information can be retrieved if you have the admin privileges. For example, on a real machine, you can get the readings of the temperature sensors, which is impossible on a VM (unless such data aren’t forwarded or simulated). If you get a valid temperature value (some 1 to 150°C), this might indicate that the computer is real. Use the commands below to check the CPU temperature:
$CPUt = Get-WmiObject MSAcpi_ThermalZoneTemperature -Namespace "root/wmi"$currentTempKelvin = $CPUt.CurrentTemperature/ 10$currentTempCelsius = $currentTempKelvin - 273.15$currentTempCelsiusIn the best case scenario, you will see the CPU temperature in degrees Celsius. Otherwise, you will get the value of -273.15, i.e. the absolute zero, which means that the temperature sensor cannot be reached in a standard way.
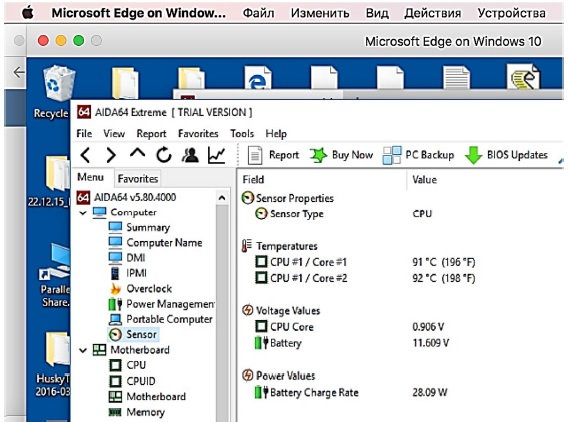
You can also test a VM with such programs as HWiNFO or AIDA64 and see for yourself that temperature values are unavailable in the virtual environment (as well as some other characteristics of the processor and hard drive). Only Parallels software can forward the readings of the temperature and voltage sensors to VMs.
And finally, you can check the graphics performance using WebGL and Canvas 3D. Warning: this technique wasn’t tested in real-life conditions yet. We suggest using standard online tests, for instance, GlowScript or Wirple. We prefer the second variant because it’s faster. The results are presented in the table below.
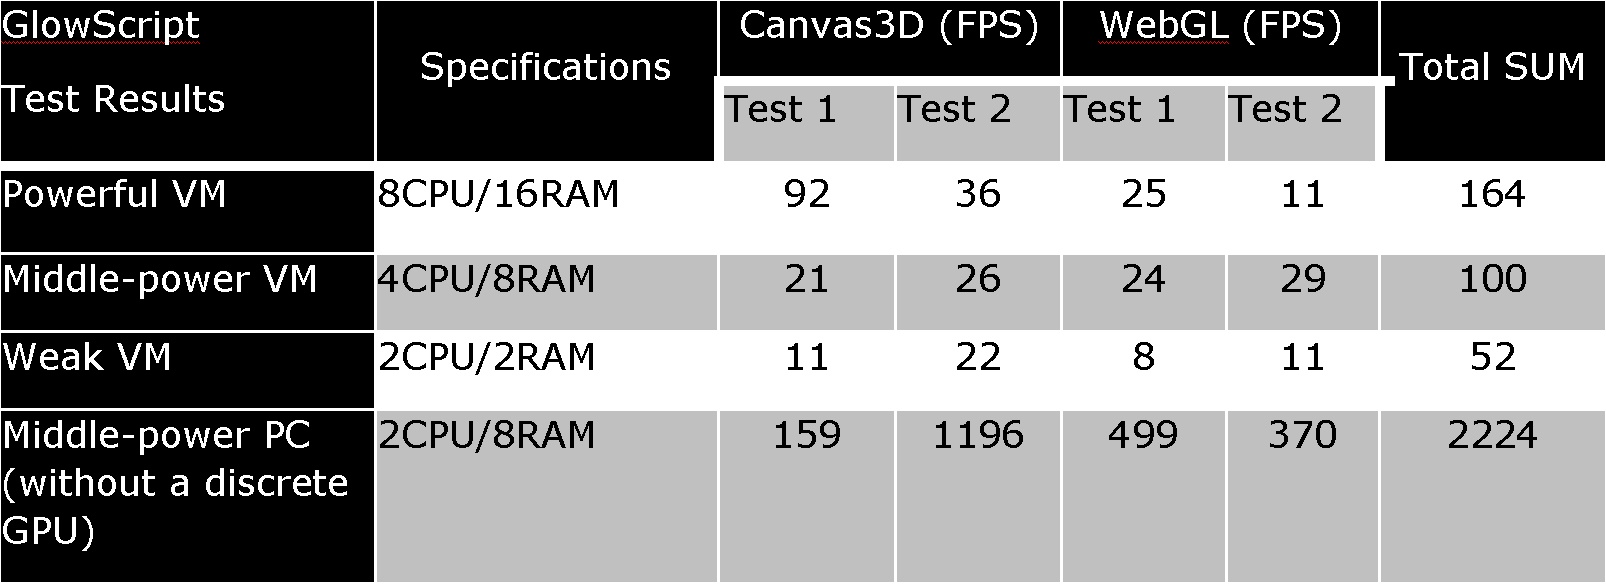
A comparison of FPS values on real and virtual computers shows that if the total sum of the four tests is less than 200 FPS, you are dealing with a VM.
In virtual environments, FPS values are orders of magnitude lower than on real machines. In our tests, the performance of VMs was 1-50 FPS, while on real and relatively modern hardware, it was some 1000-1500 FPS.
Conclusions
As you can see, not all methods can 100% determine whether the program is running in a virtual environment or not. However, using multiple methods, you can check the parameters of the host system at various levels, which significantly increases the chance to get a reliable result.
The purpose of this article was to discuss the main operation principles and primary characteristics of VMs. In a presentation delivered at Black Hat 2015, the program checks the number of logical processors and total memory size, searches for VMware in the manufacturers’ names, names of the network adapter, and the BIOS serial number, and searches for the vmtoolsd. process.
Methods used to check device attributes often cannot distinguish a real machine from a virtual one because the information on some device models cannot be retrieved using the described-above functionality, while many VMs use fine-tuning and apply system restrictions. However, the combined use of several methods targeting various attributes allows to determine the probability of a virtual machine using the weighting factors. In real life, the combination of all the above-described methods brings the correct result in 95% of cases.
To bad, there is no Big Bounty for sandboxes. We notified several vendors, including foreign ones, about bugs discovered in their products. The reactions of the vendors were different: from sarcasm (this cannot happen with our supercool system) to complete ignoring (after receiving proofs of our findings). Therefore, we decided to publish this article.
The duel between VMs and virtual environment detection techniques may continue indefinitely. But the fact is that commercial products still cannot resist some of the methods described above.
www
Plenty of sandbox detection tools can be found online. We recommend the following projects available on GitHub: InviZzzible by Check Point and awesome-sandbox-evasion project aggregation.
