Today you will learn how to:
- unpack NSIS installers and analyze extracted installation scripts;
- search for the
mainfunction wrapped in CRT (you’ll be surprised how much code the compiler implicitly pushes into an.);exe - decrypt shellcode, dump it, and search for it by the memory allocation function; and
- correctly load the retrieved shellcode to your disassembler.
Normally, I use IDA Pro for reversal, but this time, I’m going to depart from this tradition and employ open-source Ghidra. It was released several years ago; it boasts an impressive list of bug fixes and new features; and it’s free and continuously updated.
Preparations
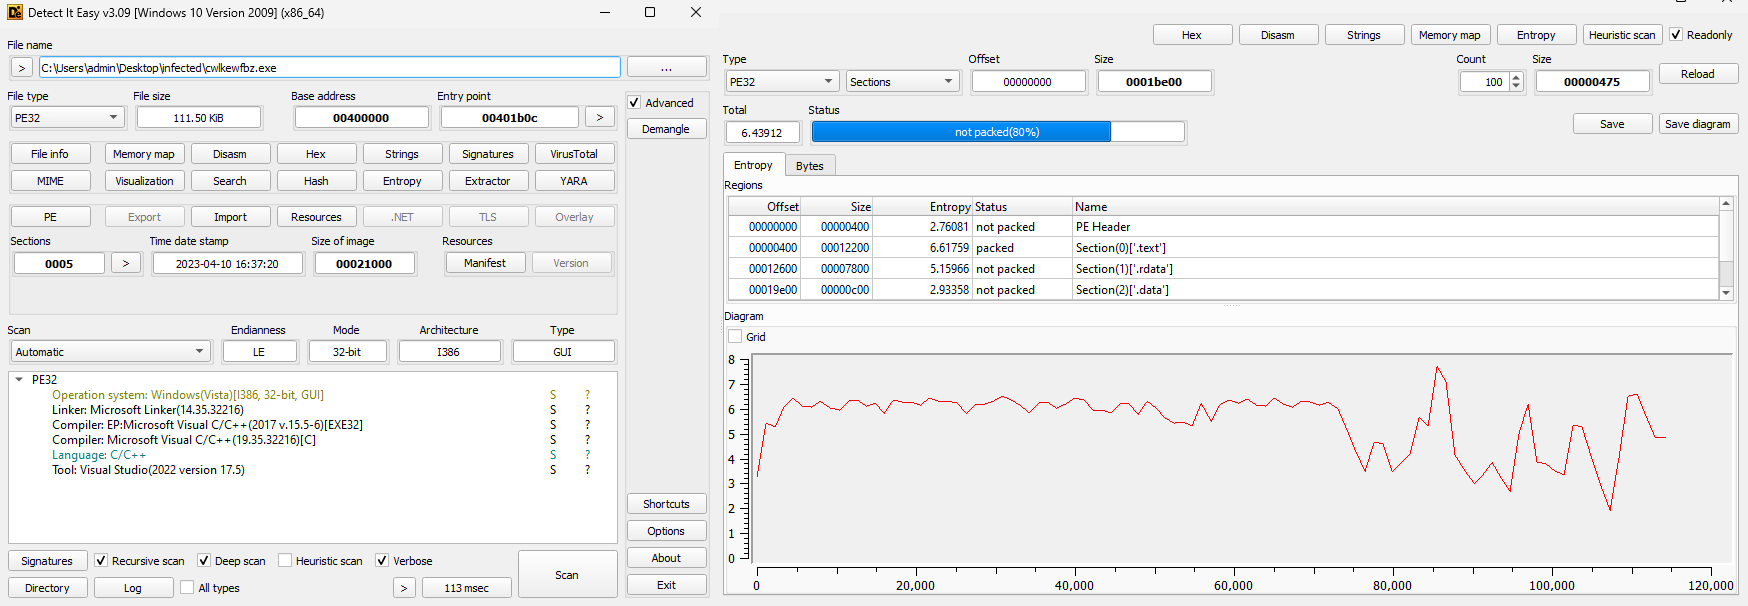
At the preliminary reconnaissance stage, the sample is loaded to the Detect It Easy (DiE) file identification tool. As you can see, the malware is distributed as an NSIS installer.

After extracting the installer contents, you get several files. Note that the unpacked files must include an NSIS script containing valuable information. An outdated version of 7-Zip can be used for unpacking (only versions 4.42-15.06 support the script extraction function).

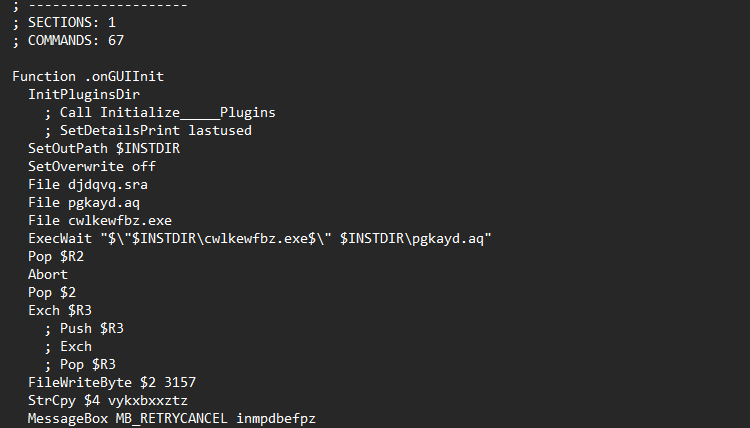
In this part of the script, you can see the list of files contained in the installer and startup parameters of the only . file (this info will be used a bit later). Other script data include the installation path InstallDir . Now let’s examine the PE file in DiE.

As you can see, the file is written in C/C++, compiled for 32-bit systems, and not packed (based on its’ not-so-high entropy). Let’s load it to Ghidra.
Reversal
Functions listed in the import table include VirtualAlloc. This function is of special interest because malicious programs often use it to allocate memory for unpacked data. After restoring the cross-reference, you can see what function is used to call it.
Of course, one could try the ‘fast’ way: load the malware to the debugger, set a breakpoint on VirtualAlloc and… get nothing, because Agent Tesla will terminate before this breakpoint. Therefore, I always recommend to examine interesting calls, as well as pieces of code adjacent, to them in the static setting first.
The function isn’t large; almost all its component are of interest; and I provide its full listing in the Ghidra decompiler:
BOOL FUN_00401300(undefined4 param_1,undefined4 param_2,LPCSTR param_3){ DWORD DVar1; DWORD DVar2; BOOL BVar3; HANDLE hFile; HANDLE hFileMappingObject; LPVOID _Src; code *_Dst; int local_8; DVar1 = GetTickCount(); Sleep(702); DVar2 = GetTickCount(); if (DVar2 - DVar1 < 700) { BVar3 = 0; } else { hFile = CreateFileA(param_3,0x80000000,1,0x0,3,0x80,0x0); if (hFile == 0xffffffff) { BVar3 = 0; } else { hFileMappingObject = CreateFileMappingA(hFile,0x0,2,0,0,0x0); if (hFileMappingObject == 0x0) { CloseHandle(hFile); BVar3 = 0; } else { _Src = MapViewOfFile(hFileMappingObject,4,0,0,0x1de0); if (_Src == 0x0) { CloseHandle(hFileMappingObject); CloseHandle(hFile); BVar3 = 0; } else { _Dst = VirtualAlloc(0x0,0x1de0,0x1000,0x40); if (_Dst == 0x0) { UnmapViewOfFile(_Src); CloseHandle(hFileMappingObject); CloseHandle(hFile); BVar3 = 0; } else { FID_conflict:_memcpy(_Dst,_Src,0x1de0); for (local_8 = 0; local_8 < 0x16c2; local_8 = local_8 + 1) { _Dst[local_8] = _Dst[local_8] ^ s_248058040134_0041c2a4[local_8 % 0xc]; } (*_Dst)(); VirtualFree(_Dst,0,0x8000); UnmapViewOfFile(_Src); CloseHandle(hFileMappingObject); BVar3 = CloseHandle(hFile); } } } } } return BVar3;}The first thing that immediately attracts attention is the piece of code containing simple anti-debugging protection:
DVar1 = GetTickCount();Sleep(702);DVar2 = GetTickCount();if (DVar2 - DVar1 < 700) { BVar3 = 0;}else {This is a popular anti-debugging trick that checks the code execution speed. If the code is executed too slowly (GetTickCount is called twice, and the execution time is measured in milliseconds), the BVar3 variable is set to 0, and the program terminates.
The next interesting piece of code opens a file; if it fails to do this, the program also terminates. This is another proof that the code must be examined in the static setting first, and only then in a debugger. So, why does the executable file terminate before the breakpoint? Let’s see what kind of file the program expects:
hFile = CreateFileA(param_3,0x80000000,1,0x0,3,0x80,0x0);if (hFile == 0xffffffff) { BVar3 = 0;Defining the main function
No doubt, the param_3 argument that passes the path to the file to CreateFileA is of special significance. This argument extends beyond this function, and there is a single cross-reference to it, which takes you to the code listed below. Note the 10 ‘interesting’ functions that can be used to indirectly determine where you are!
int __cdecl __scrt_common_main_seh(void){ code *pcVar1; bool bVar2; undefined4 uVar3; int iVar4; code **ppcVar5; _func_void_void_ptr_ulong_void_ptr **pp_Var6; byte *OpenFileArg; uint uVar7; BOOL unaff_ESI; undefined4 uVar8; undefined4 uVar9; void *local_14; // Interesting function 1 uVar3 = ___scrt_initialize_crt(1); if (uVar3 != '\0') { bVar2 = false; // Interesting function 2 uVar3 = ___scrt_acquire_startup_lock(); if (DAT_0041cb9c != 1) { if (DAT_0041cb9c == 0) { DAT_0041cb9c = 1; iVar4 = __initterm_e(&DAT_00414238,&DAT_00414254); if (iVar4 != 0) { ExceptionList = local_14; return 0xff; } FUN_00407131(&DAT_0041422c,&DAT_00414234); DAT_0041cb9c = 2; } else { bVar2 = true; } // Interesting function 3 ___scrt_release_startup_lock(uVar3); ppcVar5 = FUN_00401e6e(); if ((*ppcVar5 != 0x0) && (uVar3 = ___scrt_is_nonwritable_in_current_image(ppcVar5), // Interesting function 4 uVar3 != '\0')) { pcVar1 = *ppcVar5; uVar9 = 0; uVar8 = 2; uVar3 = 0; // Interesting function 5 _guard_check_icall(); (*pcVar1)(uVar3,uVar8,uVar9); } pp_Var6 = FUN_00401e74(); if ((*pp_Var6 != 0x0) && (uVar3 = ___scrt_is_nonwritable_in_current_image(pp_Var6), // Interesting function 6 uVar3 != '\0')) { // Interesting function 7 __register_thread_local_exe_atexit_callback(*pp_Var6); } // Interesting function 8 ___scrt_get_show_window_mode(); // Interesting function 9 OpenFileArg = __get_narrow_winmain_command_line(); unaff_ESI = main(0x400000,0,OpenFileArg); // ! uVar7 = FUN_00401fcb(); if (uVar7 != '\0') { if (!bVar2) { __cexit(); } // Interesting function 10 ___scrt_uninitialize_crt('\x01','\0'); ExceptionList = local_14; return unaff_ESI; } goto LAB_00401afd; } } FUN_00401e7a(7);LAB_00401afd: _exit(unaff_ESI);In this code, I have already defined the FUN_00401300 function as main – but how do I know that? If you looks at the code closely, you’ll see that the name of the function calling main is __cdecl . In other words, this function is the beginning of CRT runtime. It configures the required settings (including SEH, as its name suggests) and then loads the main function whose prototype is main( (i.e. it expects three arguments). Next, since the application under investigation is 32-bit, the calling code should look something like this:
push edipush esipush [eax]call mainIn the decompiled listing, you can see the following code (the OpenFileArg argument has already been named):
___scrt_get_show_window_mode();OpenFileArg = __get_narrow_winmain_command_line();unaff_ESI = main(0x400000,0,OpenFileArg);Arguments are retrieved by calling the __get_narrow_winmain_command_line( function; in addition, the ___scrt_get_show_window_mode( method is called: it indicates whether to show the application window or not. You can also see the CRT initialization and uninitialization functions: ___scrt_initialize_crt and ___scrt_uninitialize_crt. Overall, it becomes clear that this is the CRT wrapper for the main function, and, using the steps described above, you can determine the entry point to main.
info
Agent Tesla is a good example showing how much code the compiler automatically pushes into an app it builds. You write a simple “Hello world” consisting of a single function, MessageBox, and then you see plenty of interesting stuff in the import table. To avoid this, you have to tinker with the project settings.
Decrypting shellcode
So, it can be concluded that the param_3 parameter is nothing else but a path passed as a command line argument. Remember a line starting with ExecWait in the installer script? It indicates that the one of the installer files, namely pgkayd., is passed as an argument. Let’s continue examining the main function:
// Allocate memory_Dst = VirtualAlloc(0x0,0x1de0,0x1000,0x40);// If VirtualAlloc call fails, clean up and terminateif (_Dst == 0x0) { UnmapViewOfFile(_Src); CloseHandle(hFileMappingObject); CloseHandle(hFile); BVar3 = 0;}else { // Copy data to the allocated area using memcpy FID_conflict:_memcpy(_Dst,_Src,0x1de0); // XOR-based data decryption loop for (local_8 = 0; local_8 < 0x16c2; local_8 = local_8 + 1) { _Dst[local_8] = _Dst[local_8] ^ s_248058040134_0041c2a4[local_8 % 0xc]; } // Call decrypted code (*_Dst)();This code contains plenty of interesting stuff: a VirtualAlloc call used to get there, a decryption loop that applies XOR with a key to the encrypted data, and a ( call that executes the decrypted code. I added detailed comments to the listing so that its logic is clear.
info
Of course, the same results could be achieved using a debugger, but I wanted to show how this can be done using only static analysis (i.e. without exiting the disassembler).
So, the decryption functions and logic have been localized, now let’s examine Agent Tesla in dynamics! The x86dbg debugger can be used to extract the decrypted shellcode as a separate file.
Extracting shellcode as a separate file
To extract the decrypted shellcode, the file has to be executed in a debugger. As you remember from the NSIS script file, the pgkayd.aq file has to be passed as an argument to the executable to ensure its correct execution. This can be set up using the x86dbg interface.

Let’s set a breakpoint on VirtualAlloc and run Agent Tesla. This allows to skip anti-debugging and argument checking that could prevent the program from running normally (because the argument has been set in the previous step) and pause the execution at VirtualAlloc. Then the execution should be continued up to ret, thus, terminating the function. The following picture can be observed: the address of memory allocated by VirtualAlloc (which is displayed in the dump window) is stored in EAX. You know that the decryption operation will be perfrormed in this buffer; accordingly, you have to set an access breakpoint at the beginning of the buffer and wait for the data to appear there. The encrypted code will be copied to the buffer, and you’ll see it in the dump window.

Taking the information collected during static analysis, you know that encrypted data are copied to the buffer and then decrypted. If you set a breakpoint immediately after the decryption loop, you’ll see how the data in the buffer have changed. To make sure that this is meaningful code, you have to disassemble these data manually (the Follow in Disassembler option in x86dbg).

As can be seen in the screenshot, the shellcode is completely decrypted and ready to be executed. Now it has to be saved to a separate file for subsequent analysis. Select the Follow in Memory Map option in the dump context menu to switch to the memory map.

Next, click Dump Memory to File in the context menu to save the allocated memory. Note the rights of this memory area: ERW (same as RWX), which indicates that the memory is ready to be executed (a red flag for any antivirus!). The dump saved in the form of a file can be loaded to Ghidra for further research. Important: you have to manually set the analysis parameters in the disassembler.

Since the original file was 32-bit and built in Visual Studio, the same parameters should be set for the shellcode.
