
Tmux
Let’s start with the basics. As we all know, the primary tool for administering Linux is the SSH client—either the one from OpenSSH or a standalone option like PuTTY, or even an Android app. An SSH client lets you open a remote shell session and work comfortably with a machine that might be thousands of miles away. The only catch is that it’s a single session and it doesn’t preserve state.
Tmux solves this problem. It’s a terminal multiplexer that lets you open multiple terminals within a single SSH session and disconnect while preserving the session state.
Here’s how it works. You connect to a remote machine over SSH, install tmux there, and start it. You’ll see the tmux console with a status bar at the bottom and a single window open. You can use it like a normal terminal, and you can also open new windows with Ctrl+b c and switch between them with Ctrl+b 0..9 or Ctrl+b p (previous) and Ctrl+b n (next).
When you’re done, press Ctrl+b d to detach from tmux, then disconnect from the server. The next time you log in, run the command
$ tmux attach
and you’ll see all the terminals you had open, the applications running in them, your command history, and so on—exactly as it was when you detached from tmux. What’s more, it doesn’t matter which machine you reconnect from; the tmux session will be fully restored.
Tmuxinator
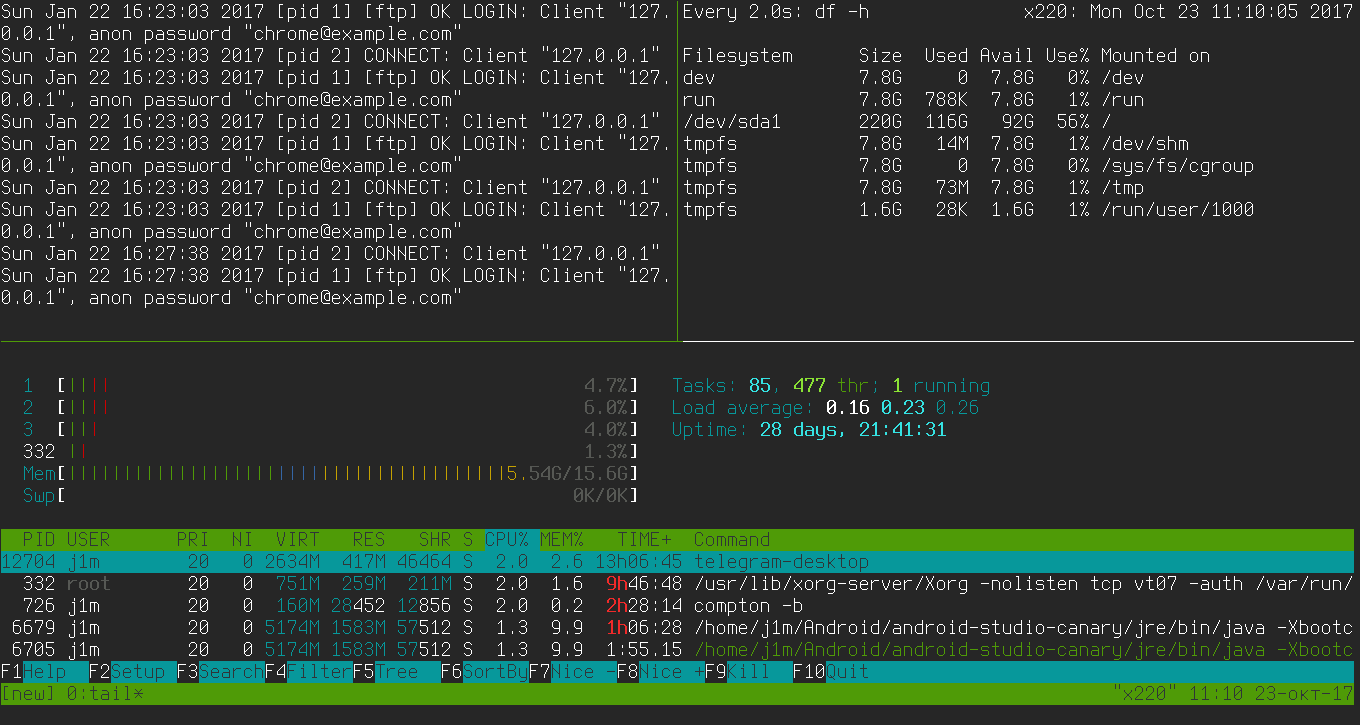
Tmux isn’t just for full-screen terminal windows. It can split the screen vertically (Ctrl+b %) and horizontally (Ctrl+b “). You can use that to build a kind of monitoring dashboard: for example, start tmux on a remote machine with three panes—one running htop, another running tail to show the latest lines from a log you care about, and a third running df to display filesystem usage.
At first glance, that kind of monitor pane seems very convenient, but what if you need to close it, run tmux with regular full-screen windows, and then open the monitor again? You can do this by using multiple tmux sessions. But that’s not ideal either, because on another server you’d have to rebuild the same window layout from scratch.
Tmuxinator makes this simpler. It lets you define the window/pane layout and the apps to launch in each, all in a configuration file. You can then use that config to quickly spin up a tmux session anywhere, anytime.
To start, create a new config:
$ tmuxinator new NAME
Tmuxinator will open the default text editor defined in the EDITOR environment variable. At the end of the config, you’ll find lines that describe the window layout. To get the layout from the example above, delete those lines and add the following ones:
windows:
    - editor:
        layout: tiled
        panes:
            - sudo tail -f /var/log/vsftpd.log
            - watch df -h
            - htop
This config defines a tmux layout with a single window split into three panes: the latest vsftpd log messages, filesystem usage, and htop. All that’s left is to start the session:
$ tmuxinator start NAME
All configuration files are stored in the ~/. directory, which makes it easy to move them between machines.
Watch
You may have noticed that in the tmuxinator config I used the command watch instead of df . That’s important because df exits right after printing the table of partitions, while we need to monitor disk status continuously. The watch utility does exactly that: every two seconds it reruns df , so the information on screen is always up to date.
You can use watch to monitor just about anything: system status (watch ), file contents (watch ), and directories (watch ); you can also run your own scripts under watch. With the -n option, you can change how often the command is rerun, and with the -d flag, you can have watch highlight changes in the output.
Multitail
Another tmuxinator config command worth mentioning is sudo . This command prints the last ten lines of the vsftpd log and waits for new entries. Every admin should be familiar with tail, as well as its counterpart on systemd-based distributions:
$ journalctl -f -u vsftpd
It’s as fundamental as navigating directories. But there’s a more interesting alternative to tail called MultiTail. Essentially, it’s tail with a multi-pane interface. It lets you display multiple logs at once by splitting the screen horizontally:
$ sudo multitail /var/log/vsftpd.log /var/log/nginx/access.log
With systemd and its journald, things get more complicated again:
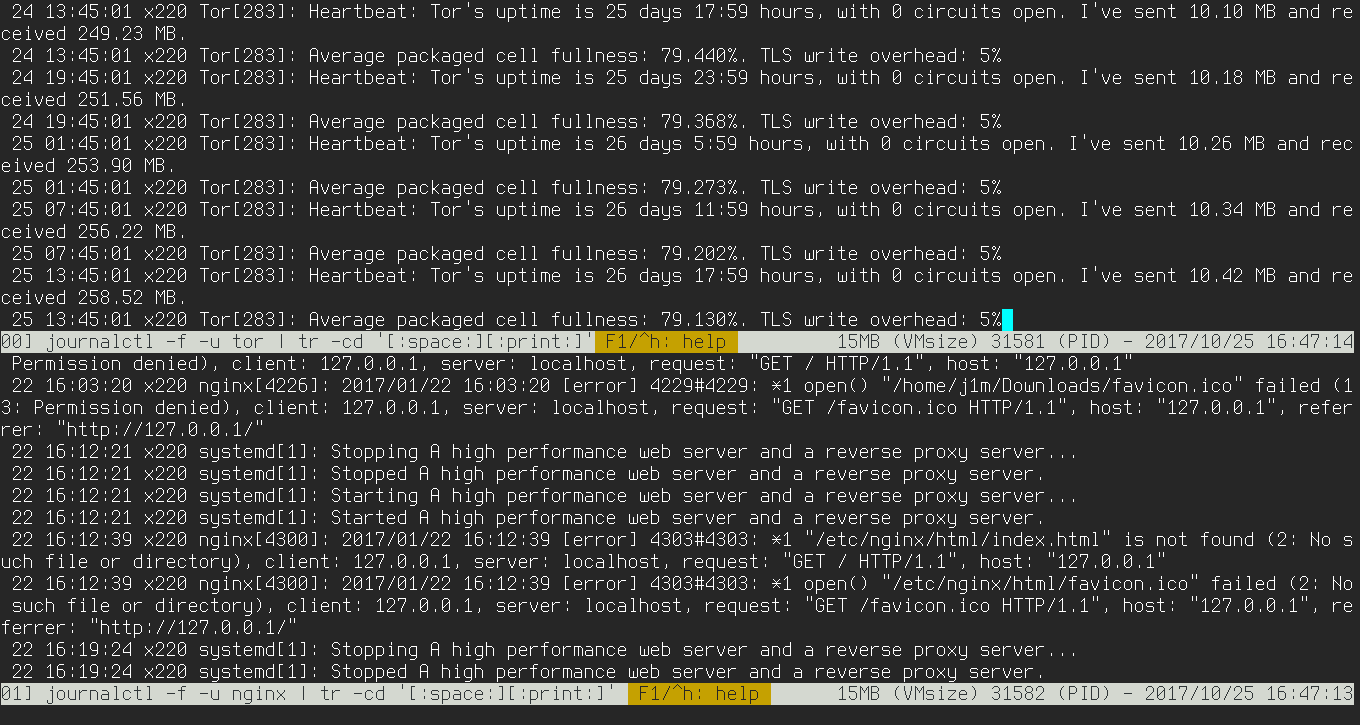
$ multitail -l "journalctl -f -u vsftpd" -l "journalctl -f -u nginx"
It gets even more complicated:
$ multitail -l "journalctl -f -u vsftpd | tr -cd '[:space:][:print:]'" -l "journalctl -f -u nginx | tr -cd '[:space:][:print:]' "
This ugly workaround is needed to strip the special control characters that systemd uses to highlight lines in the logs.
MultiSSH
Back to SSH. Sometimes you need to run the same command on multiple machines. You can do this using standard shell features as well:
for host in 192.168.0.1 192.168.0.2; do
    ssh $host "uname -a"
done
Or use a dedicated tool, such as mssh:
$ gem install mssh
$ mssh --hostlist 127.0.0.1,127.0.0.2 "uname -a
Lsof
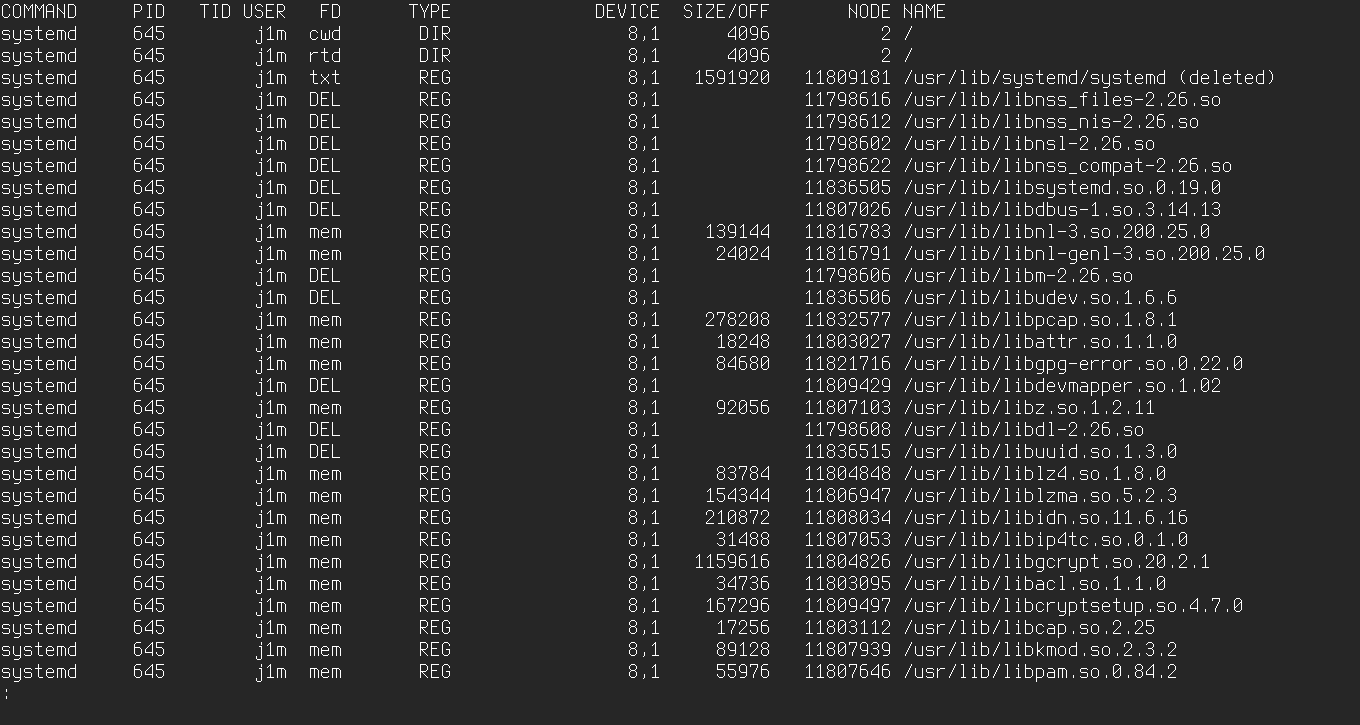
Another very important tool for any sysadmin is lsof (LiSt Open Files). This utility lets you find out which process/application has specific files open. When run without arguments, it prints a list of all open files and the processes that hold them. With flags, you can make this list more specific. For example, to find out which processes are using files in a given directory:
$ sudo lsof +D /var/log/
This can be very handy when you’re trying to unmount a filesystem and get a “Device or resource busy” error. In that case, just kill the processes that have files open on that filesystem, and you’ll be able to unmount it without any trouble. Using the -t flag, you can do it in a single pass:
# kill -9 `lsof -t +D /home`
# umount /home
You can also filter the output by application or user name. For example, the following command will list all files opened by processes whose names start with ssh:
$ lsof -c ssh
And this one will list all files opened by user vasya:
$ lsof -u vasya
lsof can also be used to list all network connections:
$ lsof -i4
You can filter the listing by a specific port:
$ lsof -i4 :80
Or get a list of all open ports:
$ lsof -iTCP -sTCP:LISTEN
Tcpdump
Every admin has to troubleshoot network services. Sometimes you can’t do without a sniffer that clearly shows how data is flowing and what might be going wrong. On Linux, Wireshark is widely considered the gold standard, but it’s not the only option. Almost every Linux distribution ships with the tcpdump console sniffer by default, which lets you quickly get to the bottom of issues.
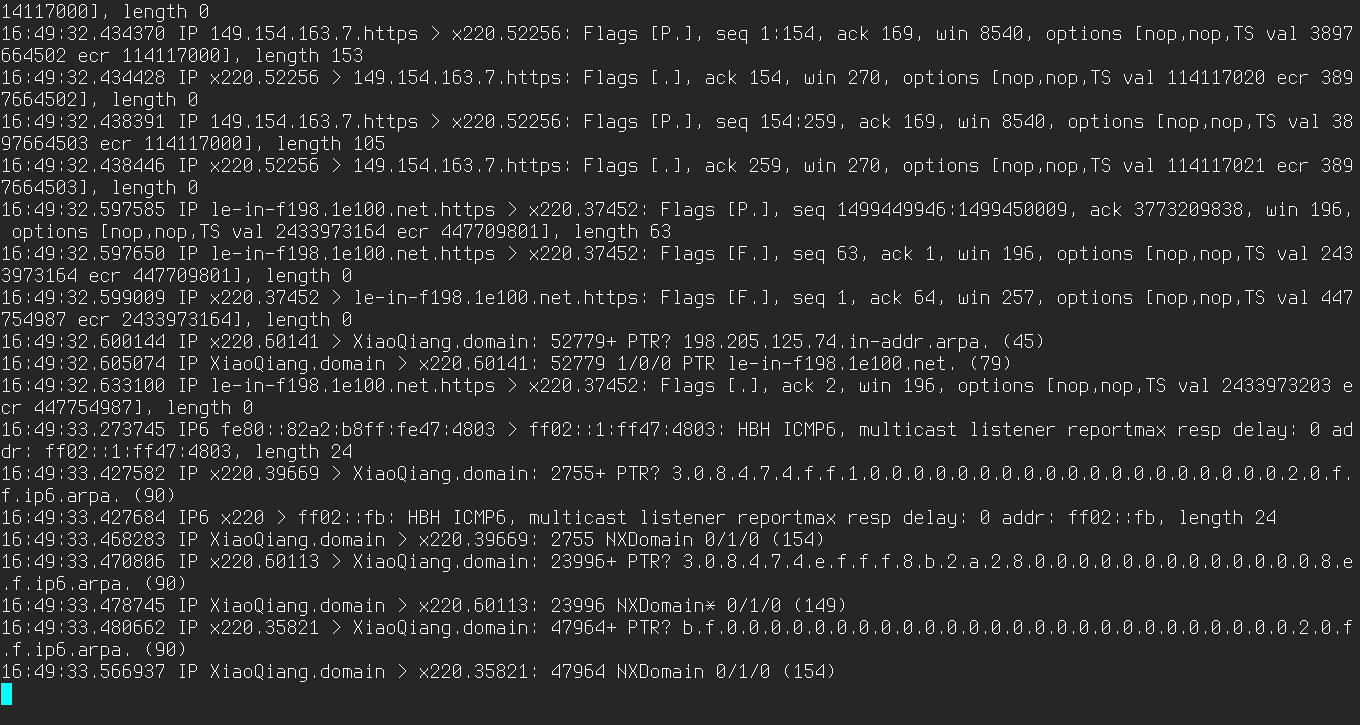
When run without any arguments, tcpdump immediately starts printing to the console a stream of all packets sent and received on all network interfaces. You can select a specific interface with the -i option:
$ sudo tcpdump -i wlp3s0
To scope tcpdump to a specific host and port, use a filter like this:
$ sudo tcpdump -i wlp3s0 host 192.168.31.1 and port 53
You can also have tcpdump output not just packet details, but their contents as well:
$ sudo tcpdump -i wlp3s0 -X host 192.168.0.1 and port 80
If the traffic is encrypted, there’s no point, but with tcpdump you can still inspect data transmitted over HTTP and SMTP.
Another useful capability of tcpdump is filtering packets by the values of specific bits or bytes in protocol headers. The syntax is: proto[expr:size], where proto is the protocol, expr is the byte offset from the beginning of the protocol header, and size is an optional field that specifies the length of the data to inspect (1 byte by default). For example, to capture only packets with the SYN flag set (the start of the TCP handshake), use the following expression:
$ sudo tcpdump 'tcp[13]==2'
The tcpdump capture file format is a de facto standard understood by almost all modern sniffers. This means you can use tcpdump to generate a capture on a remote machine, then transfer it to your local system and analyze it with Wireshark.
$ ssh root@example.ru tcpdump -w - 'port !22' | wireshark -k -i -
Ngrep
Tcpdump is excellent for its versatility and wide range of features, but it’s not the easiest or most convenient tool for searching for specific data within packets on the wire. For that task, ngrep is a much better fit—it’s designed to display only those network packets that match a given pattern.
For example, to find the parameters passed via the GET and POST methods within an HTTP session, you can use the following command:
$ sudo ngrep -l -q -d eth0 "^GET |^POST " tcp and port 80
Here’s how you can analyze SMTP traffic across all network interfaces:
$ sudo ngrep -i 'rcpt to|mail from' tcp port smtp
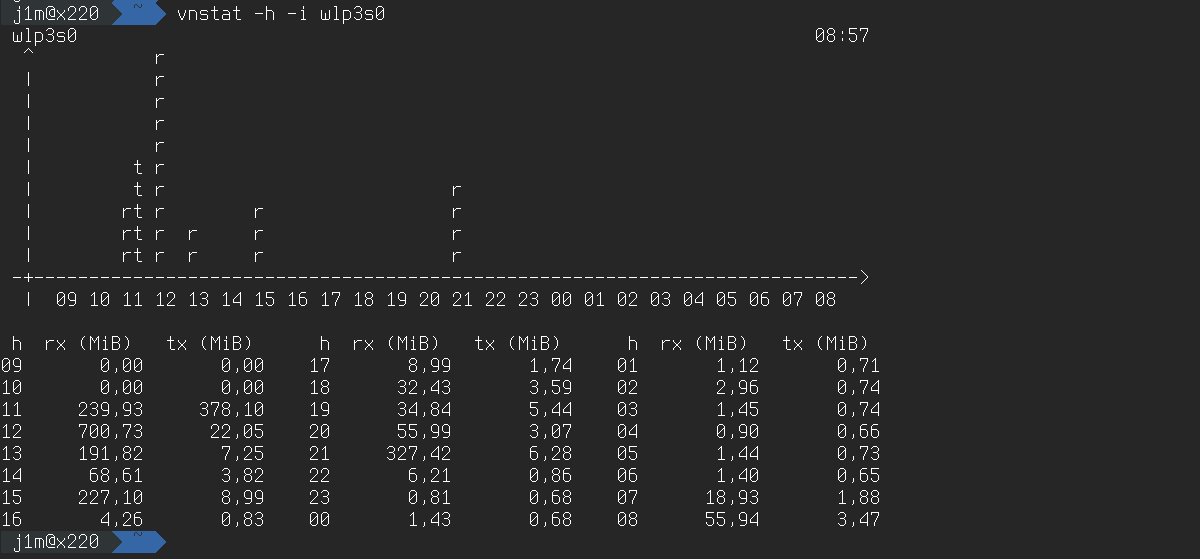
VnStat
There are plenty of systems for tracking traffic and collecting statistics. They’re often built right into a server’s remote management panel and let you analyze usage with clear, visual charts. But if you work from the console and all you need is a quick per‑interface stats readout, the best tool is vnStat.
VnStat can collect statistics continuously and persist the data across reboots, and it’s very easy to use. To get started, install the package and start the vnstat service:
$ sudo systemctl start vnstat
$ sudo vnstat -u
From now on, it will start collecting statistics. To view the stats, run the following command (replace wlp3s0 with the name of the required network interface):
$ vnstat -i wlp3s0
You can make the stats more specific—for example, show an hourly breakdown with a chart:
$ vnstat -h wlp3s0
Daily or monthly statistics:
$ vnstat -d wlp3s0
$ vnstat -m wlp3s0
Using the -t flag, you can get information on the ten days with the highest traffic usage:
$ vnstat -t wlp3s0
To monitor current activity on a network interface, you can run vnStat in live mode:
$ vnstat -l -i wlp3s0
In this mode, it will show the current data transfer rate in real time, and when it finishes, it will display statistics for the entire live monitoring session.
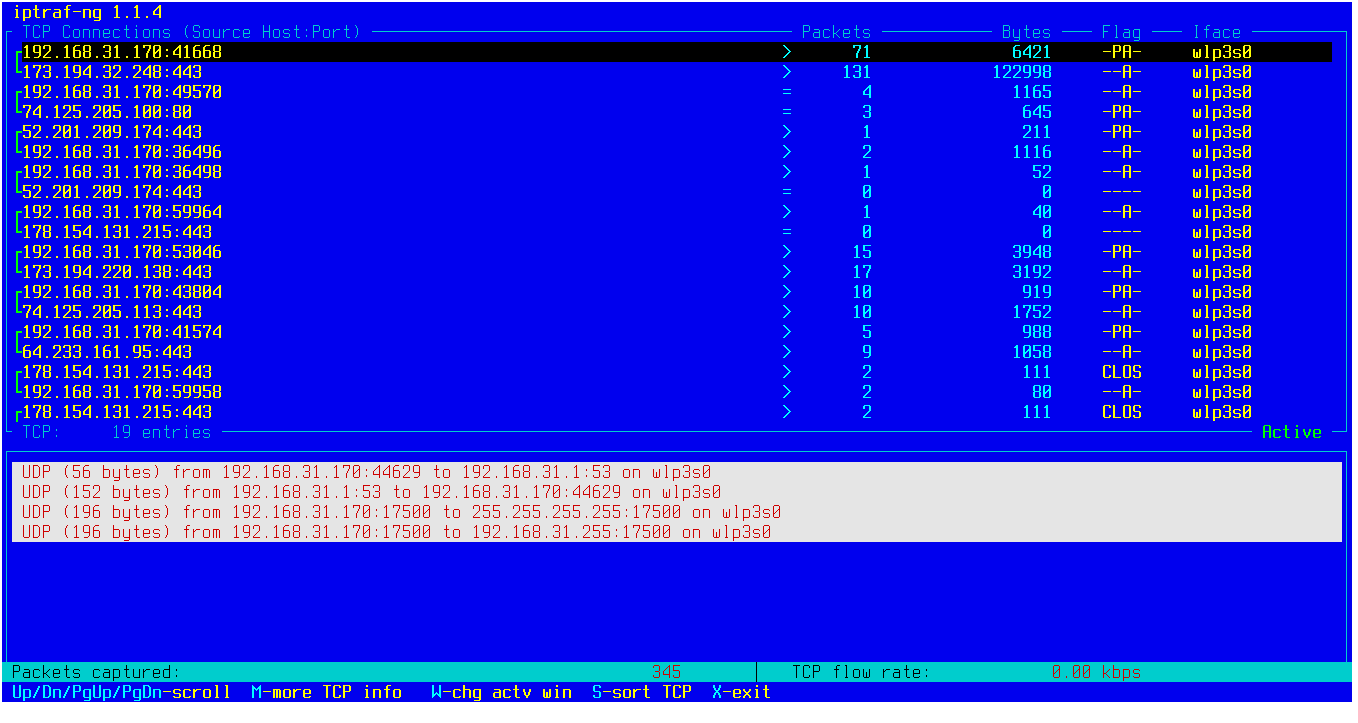
Iptraf-ng
Iptraf-ng is another handy tool for monitoring network interfaces. Like vnStat, it provides detailed bandwidth usage statistics, but its most useful feature is real-time traffic monitoring.
IPTraf provides a clear, real-time view of which hosts are currently exchanging data, the number of packets transmitted and their volume, as well as flags and ICMP messages. To access this information, select the IP traffic monitor option on the main screen.
NetHogs
VnStat and iptraf are great when you need stats for an entire interface. But what if you want to see which specific applications are currently exchanging data with remote hosts? That’s where NetHogs helps. It’s essentially top/htop for network monitoring. Install it, then run it and specify the network interface you want to watch:
$ sudo nethogs wlp3s0
A list of applications that most frequently exchange data with remote machines appears on the screen.
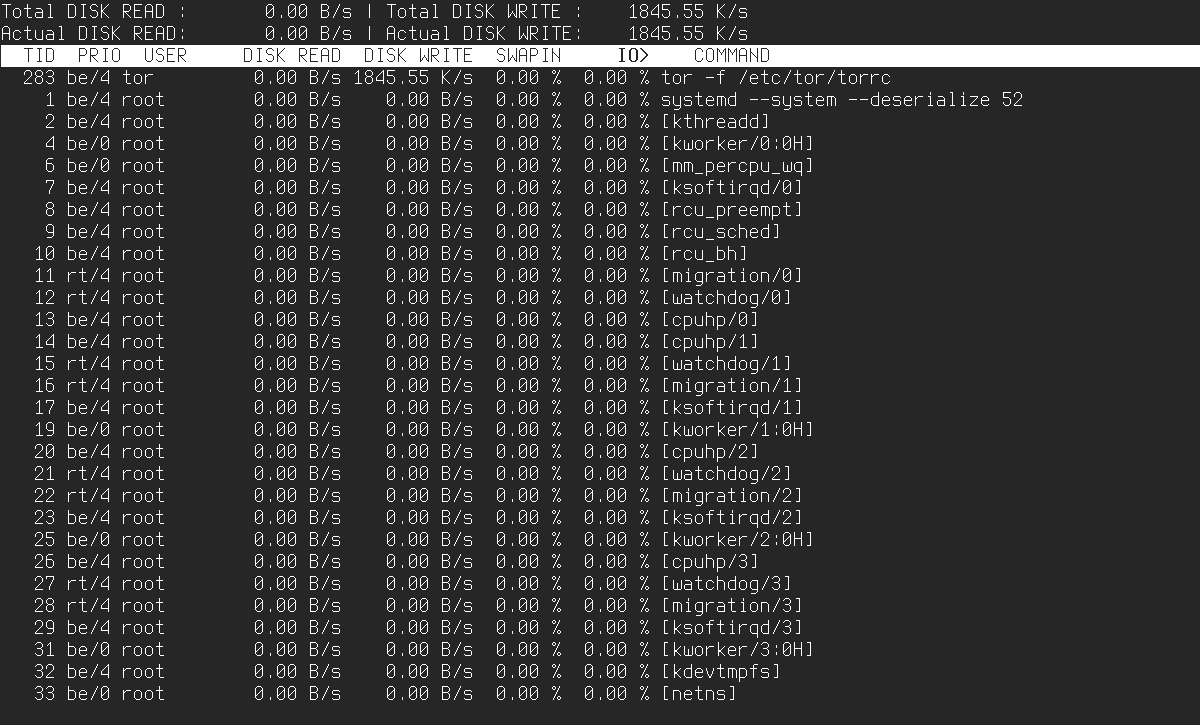
Iotop
Since we’re talking about top alternatives, we can’t skip iotop. This utility lets you see which processes are performing disk read/write operations. It’s best to run it with the --only flag; otherwise, in addition to processes currently doing I/O, it will also show some other processes that may be sleeping:
$ sudo iotop --only
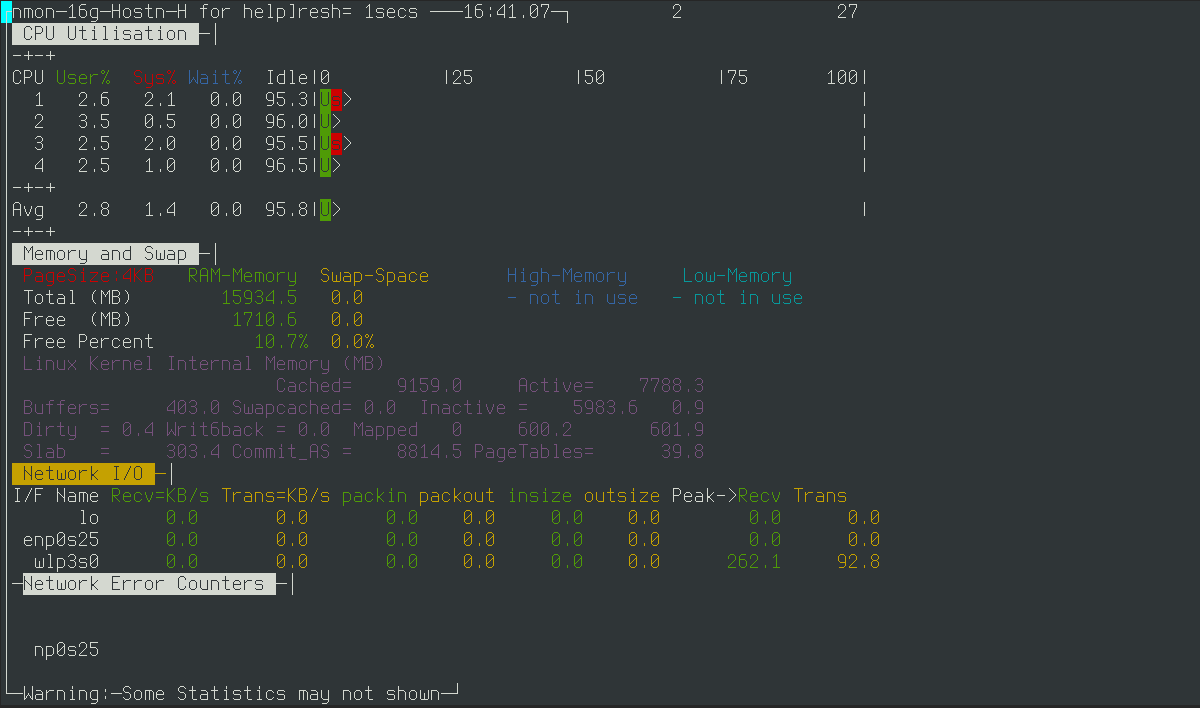
Nmon
It’s time to pull everything together. Nmon combines the features of many of the tools we’ve covered and provides real-time statistics on CPU, memory, I/O, kernel activity, and more.
Nmon is a console application with a pseudo-graphical interface. Here’s how it works: you run nmon as root, then add the metrics you want to the display. For example, press c to show CPU load, m for memory usage, d for disk I/O, n for network, t for processes, and j for filesystems. This lets you build a custom monitoring layout that shows only what you need.
In a nutshell
In this article, I tried to avoid covering tools you probably already know. But if you don’t, here’s a quick list of what might come in handy:
- top/htop — process monitors that show which tasks are consuming the most CPU.
- scp — a file copy utility for transferring to and from a remote machine over SSH.
- nmap — a port scanner that lets you run a quick, surface-level pentest (we’ve covered it in detail here: https://xakep.ru/2017/03/31/nmap-for-hackers/).
- netcat — the Swiss Army knife of networking; among other things, it lets you manually talk to servers that use plain-text protocols like HTTP and SMTP.
- dd — a block-level copying tool; you can use it to take a raw filesystem image.
- mc — a console-based, two-pane file manager.
Final thoughts
We could roll out the usual line about this being just the tip of the iceberg, that every admin has their own toolkit, and wax poetic about Linux’s flexibility, and so on. But this article simply outlines a set of solid tools that will make your life easier.