
warning
This article is intended for security specialists operating under a contract; all information provided in it is for educational purposes only. Neither the author nor the Editorial Board can be held liable for any damages caused by improper usage of this publication. Distribution of malware, disruption of systems, and violation of secrecy of correspondence are prosecuted by law.

Frankly speaking, when I stated in the previous article, that an attacker can blind Sysmon by manipulating the security descriptor of the \ device, I fibbed a little. In fact, after such manipulations, Sysmon stops generating only some of the events, not all of them. The following events received from the SysmonDrv driver (actually, their main part) aren’t generated: process startup and termination, loading DLL to the process address space, loading driver, manipulations with registry keys, etc. But there is another information provider used by Sysmon to generate its events: Event Tracing for Windows. Let’s examine this mechanism from an attacker’s perspective and manipulate it to blind Sysmon completely.
Event Tracing for Windows
Event Tracing for Windows (ETW) is a Windows subsystem that records events occurring in the system.
ETW utilizes four core concepts: providers, sessions, controllers, and consumers.
- Providers (event suppliers) are applications (e.g. DLLs) that implement event registration functions. A provider must be registered in the ETW subsystem and must have a GUID. In essence, it is the provider who tracks the state of applications (or the system) and pushes events to the session;
- Sessions (tracing sessions, loggers) are instances that collect events from providers and forward them to consumers. One session can consume events from one or more providers. Similar to providers, sessions have their own identifiers (GUIDs);
- Controllers are applications (e.g. logman) that manage sessions. They can create or delete sessions, as well as change their parameters; and
- Consumers are applications that can receive and somehow process events received from one or more sessions and from files.
It can be said that ETW is based on providers and consumers. Providers generate and transmit events about states occurring inside processes or the kernel; while consumers use these events for their own purposes (e.g. for performance analysis). Also, there is an intermediate instance between the provider and the consumer: an event tracing session.
The point is that the same provider can generate many predefined event types; some of them are intended for certain consumers; while some, for others. Event filtering occurs at the session level. In addition, one group of consumers might require events not from one, but from a group of providers at once; accordingly, a tracing session can collect events from several providers and deliver them to several consumers.
Let’s see how it looks in the OS kernel. The _ETW_SILODRIVERSTATE structure is responsible for the overall state of the ETW subsystem. Its address can be retrieved from global kernel variables.
Two fields in this structure are of special interest: EtwpLoggerContext и EtwpGuidHashTable.
Let’s examine them in more detail.
ETW Sessions
The EtwpLoggerContext field is a pointer to an array of _WMI_LOGGER_CONTEXT structures; each of them describes an event tracing session. Addresses of such structures can be retrieved as shown below.
Note that the first two addresses are 0x00000000 . Apparently, this is because two tracing sessions are predefined by the system and cannot be changed; this is why they have such values.
Let’s look at the definition of the _WMI_LOGGER_CONTEXT structure.
The above screenshot shows only the most important details:
-
LoggerIdfield is the tracing session ID; -
LoggerNamecontains the session name in the_UNICODE_STRINGformat; -
InstanceGuidis the tracing session ID in the GUID format; -
SecurityDescriptoris a pointer to the session’s security descriptor; and -
Consumersis a list of _ETW_REALTIME_CONSUMER structures; each of them contains a pointer to the_EPROCESSstructure. Each_ETW_REALTIME_CONSUMERstructure describes a separate object – event consumer.
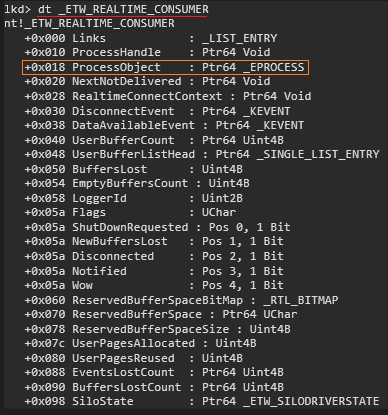
The ProcessObject field is a pointer to the _EPROCESS structure of the consumer process.
Let’s examine the 0xFFFFBA05E862D040 session as an example.
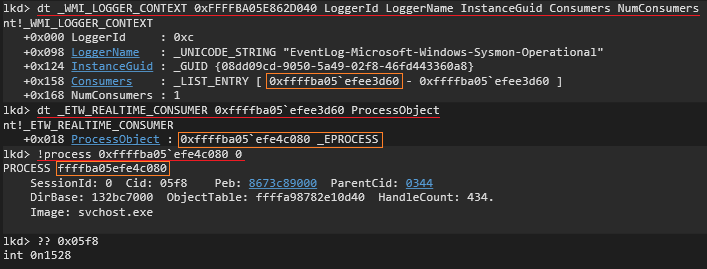
As you can see, the EventLog-Microsoft-Windows-Sysmon-Operational session has only one consumer: a process whose ID is 1528. Interestingly, what this process is?
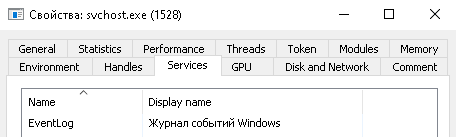
Yes, this is the Windows Event Log service that consumes events from Sysmon provider and writes them to a .evtx file (more on that later). For now, let’s get back to kernel structures.
ETW Providers
Apparently, it would make sense if _WMI_LOGGER_CONTEXT contained a pointer to the array of providers that write events to the session. But no, it works a little differently.
Each provider registered in the system is described by a _ETW_GUID_ENTRY structure.
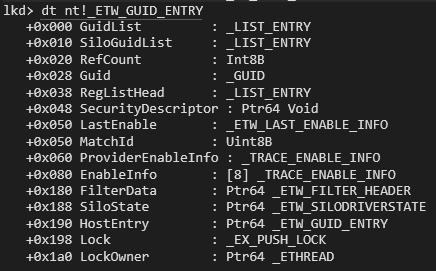
Importantly, an event provider can push events to no more than eight tracing sessions. These data are stored in the EnableInfo field that represents an array of structures of the _TRACE_ENABLE_INFO type. Each such structure contains the following information: state of provider (enabled/disabled (the IsEnable field)), session that enabled this provider (the LoggerId field), and event filtering fields (MatchAnyKeyword and MatchAllKeyword).
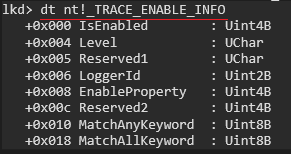
The provider parameters described in the _TRACE_ENABLE_INFO structure can be configured for all sessions at once. For this purpose, the _ETW_GUID_ENTRY structure has a separate ProviderEnableInfo field.
As you can see, each provider has its own security descriptor: the SecurityDescriptor field in the _ETW_GUID_ENTRY structure.
Note that the first element of the structure is GuidList. This is a double-linked list containing all providers. To register a new provider in the system, the kernel has to go through all elements of this list and add a link to the new structure at the end. To perform an operation with a registered provider (e.g. add a provider to a session, enable/disable it, change the security descriptor, etc.), the kernel has to go through each element until it finds the required provider, which adversely affects performance.
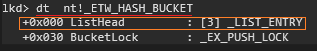
Let’s return to the main structure describing the ETW state (_ETW_SILODRIVERSTATE) and examine the EtwpGuidHashTable field: its type is _ETW_HASH_BUCKET. This field represents an array of 64 types (64 elements) of provider lists.
The thing is that, as Windows was evolving, the number of event providers increased significantly, and from the performance perspective, it’s unreasonable to store multiple providers registered in the system as a single list. Therefore, the developers decided to divide providers into groups. The sign indicating that a given provider belongs to a certain group is its hash calculated on the basis of its GUID using the formula:
Guid->Data1 XOR (Guid->Data2 XOR Guid->Data4[0] XOR Guid->Data4[4])) & 0x3F
The 0x3F value limits the hash size to six bits (64 unique values). This determines the size of the EtwpGuidHashTable array (64 elements).
Not only are providers divided into groups depending on their hash; they also belong to several types. Provider types are defined by the _ETW_GUID_TYPE enumeration. For instance, ListHead[ contains the list of providers belonging to the EtwTraceGuidType type; while ListHead[ contains the list of providers belonging to the EtwNotificationGuidType type. This complicates the representation of provider lists in the Windows kernel.
So, there are 64 groups of provider lists in the system defined by the EtwpGuidHashTable array. Each group has three different lists depending on its type. Initially, this is difficult to comprehend, but don’t worry: you’ll get used to it over time.
Let’s practice and compute hash for the provider {. Looking ahead, I can tell you that this provider is registered by the Sysmon64.exe process: Microsoft-Windows-Sysmon.
(0x5770385F XOR 0xC22A XOR 0xBF XOR 0x69) & 0x3F = 0x23
0x23 equals 35 in decimal notation. This means that this provider is stored in the 35th set of lists (i.e. in the 35th element of the EtwpGuidHashTable array). Let’s verify this:
-
Computing the 35th element of the
EtwpGuidHashTablearray:dx -r0 @$GuidTable = ((nt!_ESERVERSILO_GLOBALS*)&nt!PspHostSiloGlobals)->EtwSiloState->EtwpGuidHashTable[35] -
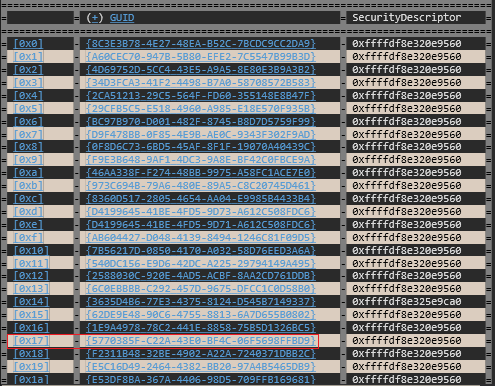
Taking the zero element of ListHead from it and displaying the contents of this list:
dx -g Debugger.Utility.Collections.FromListEntry(@$GuidTable.ListHead[0], "nt!_ETW_GUID_ENTRY", "GuidList").Select(entry => new {GUID = entry.Guid, SecurityDescriptor = entry.SecurityDescriptor}) -
Making sure that the 35th set of lists contains the Sysmon provider GUID.
NT Kernel Logger Session
As you remember, tracing sessions can be created by individual applications, but there is also a special session type in the system: NT ; it monitors predefined classes of OS kernel events (events in the I/O manager, memory manager, configuration of TCP/IP stacks, etc.). To satisfy the needs of this session, there is also a special provider in the system: SystemTraceProvider (starting with Windows 10, several providers) are generating such events.
To include a system provider in a session, the EVENT_TRACE_SYSTEM_LOGGER_MODE value (0x02000000) must be put into the LogFileMode field of the EVENT_TRACE_PROPERTIES structure. According to Microsoft, to define the list of events that should be monitored, you have to specify a ‘list’ of flags in the EnableFlags field of the EVENT_TRACE_PROPERTIES structure.
Sysmon && ETW
Hopefully, the above information was useful; now you possess knowledge required to examine Sysmon internals. Time to start the research.
To get at least some evidence that Sysmon and ETW are related to each other, let’s look at the list of handles of the Sysmon64.exe process.
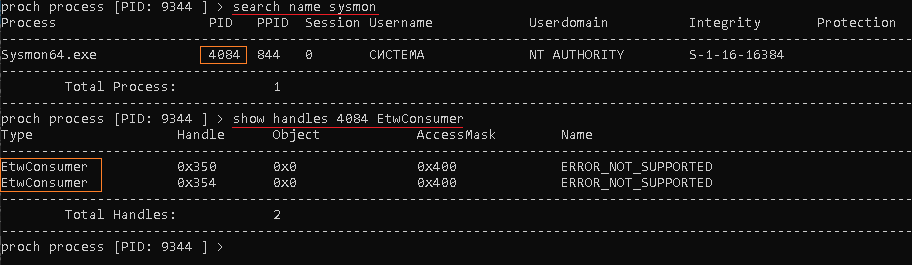
The commands search and show have been discussed in detail in the previous article.
As you can see, the handle table contains handles to two kernel objects of the EtwConsumer type. Each such object is an attached ETW consumer that can receive events from tracing sessions.
The above output indicates that the Sysmon64.exe process consumes events from two sessions. To verify this, let’s look at the list of all tracing sessions registered in the system and find sessions most suitable for Sysmon.
The search command calls the QueryAllTracesW function:
ULONG WMIAPI QueryAllTracesW( [out] PEVENT_TRACE_PROPERTIES *PropertyArray, [in] ULONG PropertyArrayCount, [out] PULONG LoggerCount);The last two parameters (PropertyArrayCount and LoggerCount) indicate the available and required numbers of elements in PropertyArray.
Let’s examine the first parameter (PropertyArray) in more detail. This is a pointer to an array of pointers to structures of the EVENT_TRACE_PROPERTIES type; each of such structures describes session parameters. An attentive reader might wonder: Why wasn’t it possible to simply pass a pointer to the array of EVENT_TRACE_PROPERTIES structures to the function? Apparently, this is because structures describing sessions don’t have a constant size.
The point is that such a structure doesn’t have the fields “log file name” and “session name” whose sizes must not exceed 1024 characters. These fields are written to memory behind the structure, and the structure itself contains only offsets (fields LogFileNameOffset and LoggerNameOffset) relative to its beginning. It seems that the developers made the size of this structure variable to save memory.
To get the list of sessions, the QueryAllTracesW function must be called at least twice. The first call returns the number of sessions. Based on this information, the following steps have to be taken:
- Allocate memory for an array of pointers where the number of elements is equal to the number of sessions;
- Allocate buffer memory to store information about all sessions;
- Divide the buffer memory into chunks (each of these chunks will store information about a separate session) and initialize the array of pointers declared in the first step with the addresses of each chunk; and
- For each buffer chunk (i.e. for each
EVENT_TRACE_PROPERTIESstructure), set values of theBufferSize,LoggerNameOffset, andLogFileNameOffsetfields.
Then the QueryAllTracesW function is called again to get the list of sessions (provided that the allocated buffer size is sufficient to store this information).
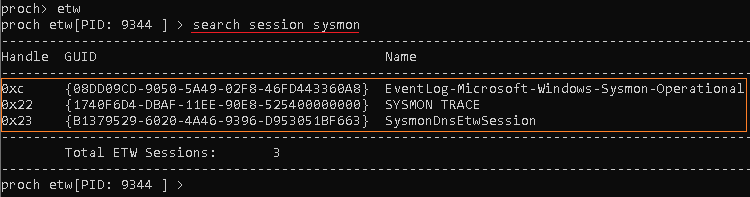
The above-described manipulations bring three sessions similar to Sysmon in name. As was found out earlier, the EventLog-Microsoft-Windows-Sysmon-Operational session was created to enable the Windows Event Log service to consume events from Sysmon and write them to the respective log file. This session can be left for last; for now, let’s focus on the SysmonDnsEtwSession and SYSMON sessions.
But first, let’s make sure that their consumer is the Sysmon64.exe process. I strongly doubt that this can be done in user mode; so, it’s time to use a debugger.
WinDbg has the ! extension that enables you to conveniently work with ETW structures. Using the ! command, you can get a list of ETW sessions.
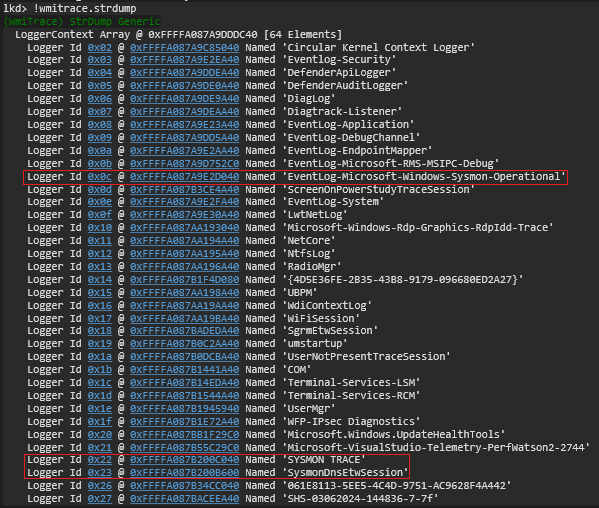
The ! command displays detailed information about the SYSMON session.
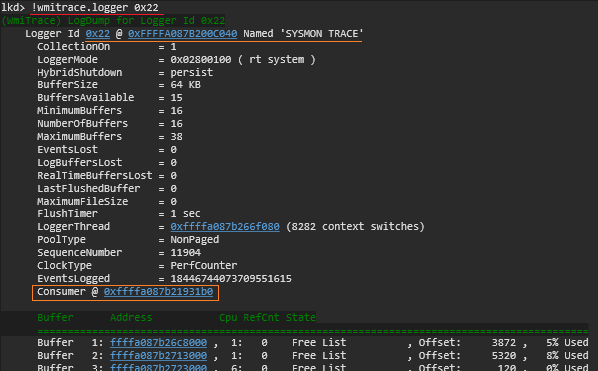
The Consumer field contains a single-element list of addresses of _ETW_REALTIME_CONSUMER structures, and each of these structures contains a pointer to _EPROCESS.
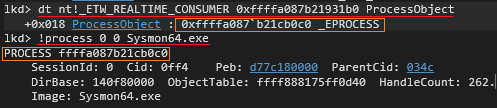
This confirms that the consumer of the SYSMON session is the Sysmon64.exe process.
The consumer for the SysmonDnsEtwSession session is also Sysmon64.exe. You can check this yourself using a similar sequence of operations.
Manipulating ETW and blinding Sysmon
As shown above, Sysmon creates multiple tracing sessions that are required for its operation. Let’s see what kind of manipulations can be performed by attackers trying to blind Sysmon.
Disabling SysmonDnsEtwSession session providers
Since sessions receive events from providers, and each provider has an array of its states in the _ETW_GUID_ENTRY structure, the first thing that comes to mind (from an attacker’s perspective) is to disconnect the provider from the session.
Let’s look at the list of providers sending events to the SysmonDnsEtwSession session.
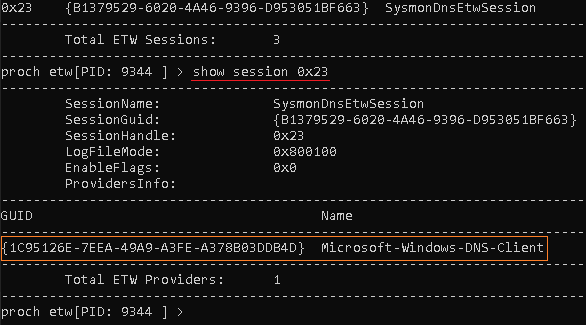
The show command calls the ControlTraceW function with the EVENT_TRACE_CONTROL_QUERY parameter.
ULONG WMIAPI ControlTraceW( [in] TRACEHANDLE TraceHandle, [in] LPCWSTR InstanceName, [in, out] PEVENT_TRACE_PROPERTIES Properties, [in] ULONG ControlCode);Let’s go through the above parameters.
-
TraceHandletakes the identifier (session handle); -
InstanceNameis the session name. One of the first two parameters can be NULL; - The next parameter returns the session description structure
EVENT_TRACE_PROPERTIES; and -
ControlCodespecifies the operation code. In this particular case, it’sEVENT_TRACE_CONTROL_QUERY.
This function provides information about the session name, its GUID, and the LogFileMode and EnableFlags parameters, but it doesn’t return information about providers.
But you still need information about providers that send events to the session. I don’t know an easy way to get the list of providers for a specific session. Taking perfmon. as model, the logic can be as follows: (1) get a full list of providers registered in the system; and (2) go through them one by one and find signs indicating that a given provider belongs to an ETW session. Generally speaking, this logic repeats the provider representation structure in the Windows kernel.
The TdhEnumerateProviders function returns the list of providers:
TDHSTATUS TdhEnumerateProviders( [out] PPROVIDER_ENUMERATION_INFO pBuffer, [in, out] ULONG *pBufferSize);To be specific, this function returns a data structure of the PROVIDER_ENUMERATION_INFO type containing information about the number of providers registered in the system (NumberOfProviders parameter) and an array of the TRACE_PROVIDER_INFO type that describes each provider separately, including its name (calculated using ProviderNameOffset) and GUID (the ProviderGuid field). In other words, the TdhEnumerateProviders function returns information about providers’ names and GUIDs, but doesn’t indicate which providers belong to a given session.
To get the outstanding information, the EnumerateTraceGuidsEx function has to be called for each provider:
ULONG WMIAPI EnumerateTraceGuidsEx( [in] TRACE_QUERY_INFO_CLASS TraceQueryInfoClass, [in] PVOID InBuffer, [in] ULONG InBufferSize, [out] PVOID OutBuffer, [in] ULONG OutBufferSize, [out] PULONG ReturnLength);Let’s go through its parameters:
-
TraceQueryInfoClassdetermines the type of information to return. In this particular case, it’s TraceGuidQueryInfo, which means that you require information about the provider; - The provider GUID is passed as
InBuffer; -
InBufferSizedefines the buffer size; -
OutBufferis a pointer to the returned buffer; and - The fifth (
OutBufferSize) and sixth (ReturnLength) parameters indicate the size of available memory and memory required to store data returned by the function.
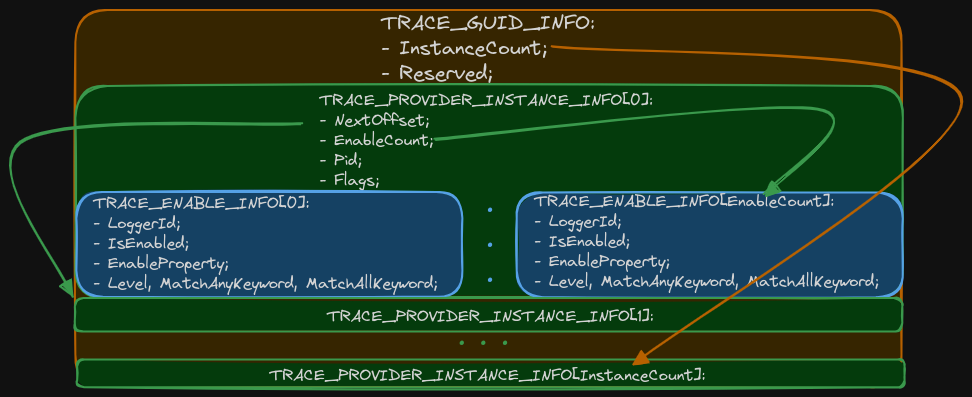
The OutBuffer parameter is a data structure whose header is TRACE_GUID_INFO.
After the header, there are one or more structures of the TRACE_PROVIDER_INSTANCE_INFO type; each of them describes which provider belongs to which session and event filtering parameters. Visually, this can be represented as follows.
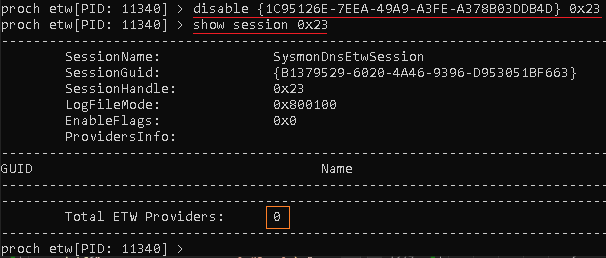
As you can see, just one provider is attached to the session: Microsoft-Windows-DNS-Client. Let’s detach it from the SysmonDnsEtwSession session using the EnableTraceEx2 function with the EVENT_CONTROL_CODE_DISABLE_PROVIDER parameter:
ULONG WMIAPI EnableTraceEx2( [in] TRACEHANDLE TraceHandle, [in] LPCGUID ProviderId, [in] ULONG ControlCode, [in] UCHAR Level, [in] ULONGLONG MatchAnyKeyword, [in] ULONGLONG MatchAllKeyword, [in] ULONG Timeout, [in, optional] PENABLE_TRACE_PARAMETERS EnableParameters);-
TraceHandleis the tracing session handle. In this particular case, it’s value is 0x23; -
ProviderIdis used to pass the provider GUID. For theMicrosoft-Windows-DNS-Clientprovider, it’s value is{;1C95126E-7EEA-49A9-A3FE-A378B03DDB4D} -
ControlCodetakes the operation type (EVENT_CONTROL_CODE_DISABLE_PROVIDER); -
Levelis the logging level. It should be set to TRACE_LEVEL_INFORMATION; - The fifth and sixth parameters (
MatchAnyKeywordandMatchAllKeyword) take event filtering parameters. Let’s set them to0xFFFFFFFFFFFFFFFFand0x00, respectively; and - The two last parameters (
TimeoutandEnableParameters) should be set to zero.
The disable < command calls the EnableTraceEx2 function.
Now let’s open Event Viewer and try to resolve several DNS names to make sure that no “EventID 22 (DNS query)” events appear in the Microsoft-Windows-Sysmon\ log.
Great! The attacker managed to hide name resolution events from Sysmon, but one event type is still generated: “EventID 3 (Network connection detection)”.
Playing with SYSMON TRACE session flags
Let’s see what providers push events to the SYSMON session.
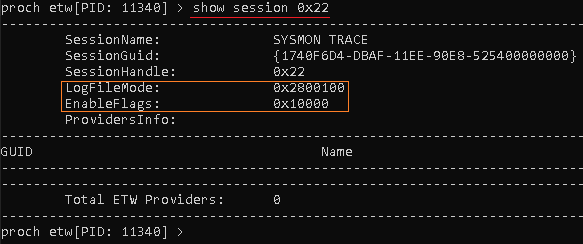
As you can see, the provider list is empty, but note the value of the LogFileMode parameter. Do you remember the special session type, NT , mentioned earlier? The above screenshot indicates that the list of parameters contains EVENT_TRACE_SYSTEM_LOGGER_MODE (0x02000000). This means that its provider is SystemTraceProvider, and the list of event types is determined by the EnableFlags parameter (0x10000).
Imagine that the attacker wants to disable all types of system provider events. This can be done by calling the ControlTraceW function with the EVENT_TRACE_CONTROL_UPDATE parameter. And the EVENT_TRACE_PROPERTIES structure with the EnableFlags parameter equal to 0x00 can be passed to this function. The set command performs these operations.

Now let’s open Event Viewer and try to establish a connection with some server. Voila! As you can see, not only “EventID 22 (DNS query)”, but also “EventID 3 (Network connection detection)” are absent in the Microsoft-Windows-Sysmon\ event log.
Manipulating security descriptors of the EventLog-Microsoft-Windows-Sysmon-Operational session
Under normal conditions, all information received from the SysmonDrv kernel module (see the previous article for more detail) and from the ETW subsystem is aggregated in the Sysmon user mode service that writes it to the Microsoft-Windows-Sysmon\ event log.
This mechanism also involves ETW sessions and providers. As shown earlier, there are three sessions in the system whose names are similar to Sysmon, and the first such session is EventLog-Microsoft-Windows-Sysmon-Operational. As you remember, it was left for last, and now it’s time to examine it in detail.
First, let’s get its provider list.
The session has one ETW provider: Microsoft-Windows-Sysmon.
Earlier, it was shown that each kernel structure describing session and provider objects has a SecurityDescriptor field that can be manipulated.
Let’s try to change SecurityDescriptors for the Microsoft-Windows-Sysmon provider and for the EventLog-Microsoft-Windows-Sysmon-Operational session and see what happens.
info
Prior to this experiment, you have to revert all changes and make sure that Sysmon writes events to its log.
To look at the provider’s security descriptor, EventAccessQuery has to be called:
ULONG EVNTAPI EventAccessQuery( [in] LPGUID Guid, [in, out] PSECURITY_DESCRIPTOR Buffer, [in, out] PULONG BufferSize);- Amazing but true:
Guidis the session’s or provider’s GUID; -
Bufferis the address of the buffer where the session’s or provider’s security descriptor will be stored; and - The last parameter (
BufferSize) receives and returns the buffer size.

The security descriptor looks as follows:
O:BAG:BAD:(A;;0x1800;;;WD)(A;;0x120fff;;;SY)(A;;0x120fff;;;LS)(A;;0x120fff;;;NS)(A;;0x120fff;;;BA)(A;;0xee5;;;LU)(A;;LC;;;MU)(A;;0x1800;;;AC)(A;;0x1800;;;S-1-15-3-1024-3153509613-960666767-3724611135-2725662640-12138253-543910227-1950414635-4190290187)
The first entry in DACL, (, indicates that the Everyone account should be granted the following access:
TRACELOG_ACCESS_KERNEL_LOGGER | TRACELOG_REGISTER_GUIDS
The second entry (() grants full access to the Local account.
Let’s explicitly deny access to the provider for Local (D;;0x120fff;;;SY) and remove ACE for the Everyone account by calling the EventAccessControl function:
ULONG EVNTAPI EventAccessControl( [in] LPGUID Guid, [in] ULONG Operation, [in] PSID Sid, [in] ULONG Rights, [in] BOOLEAN AllowOrDeny);- The first parameter (
Guid) is the GUID of the provider or session whose security descriptor should be altered; - The second one (
Operation) specifies the operation type (e.g. add an entry to DACL/SACL or completely replace these lists); - The third parameter (
Sid) is the ID of the account whose access rights should be changed; - The fourth parameter (
Rights) is the list of access rights (mask); and - The last parameter (
AllowOrDeny) determines the operation type: allow or deny.
To call this function, execute the set command.

After a reboot, you can see that there are no events in the Sysmon log. Furthermore, the last recorded event is EventID . Unlike the previously described tricks, this technique is persistent.

Congrats! One more detection rule for your SIEM:
Provider Name='Microsoft-Windows-Sysmon' and EventID='255' and Data Name.Description='Failed to open service configuration with error 94 - Last error: The media is write protected.'
Now let’s revert the changes and try to perform similar manipulations for the tracing session. DACL looks as follows:
D:(A;;0x1800;;;WD)(A;;0x120fff;;;SY)(A;;0x120fff;;;LS)(A;;0x120fff;;;NS)(A;;0x120fff;;;BA)(A;;0xee5;;;LU)(A;;LC;;;MU)(A;;0x1800;;;AC)(A;;0x1800;;;S-1-15-3-1024-3153509613-960666767-3724611135-2725662640-12138253-543910227-1950414635-4190290187)
As is the case involving the provider, reboot the host, open Event Viewer – and you’ll see the following picture.

An outright victory for the attacker and a fatal defeat for the admin… This time Sysmon won’t even give voice!
However, it’s not all that bad: if you have WEC configured in your infrastructure, you can find the following event in the Microsoft-Windows-Eventlog-ForwardingPlugin/ log.

Conclusions
Now you know how to blind Sysmon by manipulating the ETW subsystem. Of course, hacker’s fantasy has no limits, and there is still plenty of room for your creative experiments.
Good luck!