
Thanks to Dennis Ritchie, it’s become customary to start learning a new programming language by writing a simple “Hello, World!” program. Let’s stick with that tradition and use the following example to explore what IDA Pro can do.
info
To follow the article exactly, compile the examples with Visual C++ 2017 by running: cl.. The / flag is needed to silence the compiler and to enable proper object-destruction semantics (stack unwinding).
#include <iostream>void main(){ std::cout << "Hello, Sailor!\n";}The compiler will produce an executable of nearly 190 KB, most of which is runtime, startup, or library code. Trying to disassemble it with tools like W32Dasm won’t yield quick results: the generated listing is about 2.5 MB (!) and can keep you busy for hours. Now imagine how long it would take for real tasks that require sifting through tens or even hundreds of megabytes of disassembly.
Let’s try disassembling this program with IDA. If you keep all settings at their defaults, then once the analysis finishes the screen should look like this.

To open the text view, select the Text view option from the context menu.
Which IDA Pro Version Should You Choose?
At the time of writing, the latest version of IDA Pro was 7.3. Its price can be a bit steep for research-only use. As is well known, Ilfak Guilfanov takes a hard line on leaks and the unauthorized distribution of his company’s products online and does not tolerate it.
However, Hex-Rays provides a free, feature-limited version of the disassembler for public download on its website. For example, it doesn’t receive updates once the paid version moves past a major milestone; currently, version 7.0 is available for free download. It also only supports x86 and x64 architectures.
Still, that’s more than enough for our purposes. We won’t have to dig into code for ARM, Motorola, SPARC, MIPS, or Zilog processors. There’s also a restriction on commercial use, but we’re in the clear on that front as well.
After IDA finishes auto-analyzing the file first., it will move the cursor to . — the program’s entry point. Don’t forget to switch from Graph view to Text view. Also note the line ., highlighted in red at the end of the start function. This is how IDA marks the last line of a function when it ends with a return and the stack pointer value on exit differs from its value on entry.
Among novice programmers, there’s a widespread misconception that C programs start executing in the main function. That’s not quite true. In reality, immediately after the executable is loaded, control is passed to a startup routine (often called _start) inserted by the toolchain. It prepares global variables:
- argc — number of command-line arguments
- argv — array of pointers to the argument strings
- _environ — array of pointers to the environment variable strings
The OSVERSIONINFOEX structure is populated, which, among other things, includes:
-
dwBuildNumber— build number; -
dwMajorVersion— major OS version; -
dwMinorVersion— minor OS version; -
_winver— full OS version; -
wServicePackMajor— Service Pack major version; -
wServicePackMinor— Service Pack minor version.
Next, Start initializes the heap and calls the main function, and when control returns, it terminates the process using Exit. The GetVersionEx function is used to obtain the values for the OSVERSIONINFOEX structure.
The following program demonstrates how the startup code initializes variables and how to access their values.
CRtO.demo.c
#include <stdio.h>#include <stdlib.h>#include <Windows.h>void main(){  OSVERSIONINFOEX osvi;  ZeroMemory(&osvi, sizeof(OSVERSIONINFOEX));  osvi.dwOSVersionInfoSize = sizeof(OSVERSIONINFOEX);  GetVersionEx((OSVERSIONINFO*)&osvi);  int a;  printf(">OS Version:\t\t\t%d.%d\n\  >Build:\t\t\t%d\n\  >Arguments count:\t%d\n", \
    osvi.dwMajorVersion, osvi.dwMinorVersion, osvi.dwOSVersionInfoSize, __argc);  for (a = 0; a < __argc; a++)    printf(">\t Argument %02d:\t\t%s\n", a + 1, __argv[a]);  a = !a - 1;  while (_environ[++a]);    printf(">Environment variables count:%d\n", a);  while (a)    printf(">\tVariable %d:\t\t%s\n", a, _environ[--a]);}
The main function’s prototype seems to indicate that the application doesn’t accept any command-line arguments, but the program’s output suggests otherwise, and on my machine it looks like this (abridged):
OS Version: 6.2
Build: 156
Arguments count: 1
Argument 01: CRt0.demo.exe
Environment variables count: 99
…
Variable 20: FrameworkVersion=v4.0.30319
Variable 19: FrameworkDIR32=C:\WINDOWS\Microsoft.NET\Framework\
Variable 18: FrameworkDir=C:\WINDOWS\Microsoft.NET\Framework\
Variable 17: Framework40Version=v4.0
Variable 16: ExtensionSdkDir=C:\Program Files (x86)\Microsoft SDKs\Windows Kits\10\ExtensionSDKs
Variable 15: DriverData=C:\Windows\System32\Drivers\DriverData
Obviously, there’s no need to dig through the standard application startup code; the analyst’s first task is to find where control is handed off to the main function. Unfortunately, to be absolutely certain, you’d need a full analysis of the Start function’s body. Researchers have plenty of tricks to avoid this, but they all depend on compiler-specific implementation details and can’t be considered universal.
For example, Visual C++ always passes three arguments to main, regardless of its declared prototype: a pointer to the array of environment pointers, a pointer to the array of command-line argument pointers, and the number of command-line arguments; all other startup routines take fewer parameters.
I recommend reviewing the startup routine sources of popular compilers. For Visual C++ 14, they’re located in architecture-specific subfolders of the %\ directory. Studying them will make it easier to analyze disassembly listings.
Below is an illustrative snippet of the first. program’s startup code, produced by W32Dasm.
//******************** Program Entry Point ********************
:0040628B E802070000 call 00406992
:00406290 E974FEFFFF jmp 00406109
*
|:0040380C , :004038B2 , :0040392E , :00403977 , :00403A8E
|:00404094 , :004040FA , :00404262 , :00404BF4 , :00405937
|:004059AE
|
*
|:004062B6(U)
|
:00406295 8B4DF4 mov ecx, dword ptr [ebp-0C]
:00406298 64890D00000000 mov dword ptr fs:[00000000], ecx
:0040629F 59 pop ecx
:004062A0 5F pop edi
:004062A1 5F pop edi
:004062A2 5E pop esi
:004062A3 5B pop ebx
:004062A4 8BE5 mov esp, ebp
:004062A6 5D pop ebp
:004062A7 51 push ecx
:004062A8 F2 repnz
:004062A9 C3 ret
…
IDA’s output looks different: it can identify library functions by their signatures—roughly the same approach used by many antivirus engines.
A disassembler’s capabilities depend heavily on its version and on how complete your bundle is—by no means all IDA Pro releases can handle binaries produced by modern compilers.
.text:0040628B start proc near
.text:0040628B
.text:0040628B ; FUNCTION CHUNK AT .text:00406109 SIZE 00000127 BYTES
.text:0040628B ; FUNCTION CHUNK AT .text:00406265 SIZE 00000026 BYTES
.text:0040628B
.text:0040628B call sub_406992
.text:00406290 jmp loc_406109
.text:00406290 start endp ; sp-analysis failed
.text:00406290
.text:00406295 ; [00000015 BYTES: COLLAPSED FUNCTION __EH_epilog3. PRESS CTRL-NUMPAD+ TO EXPAND]
.text:004062AA ; [00000011 BYTES: COLLAPSED FUNCTION __EH_epilog3_GS. PRESS CTRL-NUMPAD+ TO EXPAND]
.text:004062BB ; [00000034 BYTES: COLLAPSED FUNCTION __EH_prolog3. PRESS CTRL-NUMPAD+ TO EXPAND]
.text:004062EF ; [00000037 BYTES: COLLAPSED FUNCTION __EH_prolog3_GS. PRESS CTRL-NUMPAD+ TO EXPAND]
.text:00406326 ; [00000037 BYTES: COLLAPSED FUNCTION __EH_prolog3_catch. PRESS CTRL-NUMPAD+ TO EXPAND]
.text:0040635D
.text:0040635D ; =============== S U B R O U T I N E ===============
.text:0040635D
.text:0040635D ; Attributes: thunk
.text:0040635D
.text:0040635D sub_40635D proc near ; CODE XREF: sub_4042FD+19↑p
.text:0040635D jmp sub_406745
.text:0040635D sub_40635D endp
.text:0040635D
.text:00406362
…
You can find the list of supported compilers in the file %IDA%/. It includes the old Microsoft C and Quick C, Visual C++ versions 1 through 8, and Visual .NET. Visual C++ 14 from Visual Studio 2017 isn’t listed, though. Still, looking at the IDA window, we can see the disassembler recognized many (though not all) functions.
Let’s check the Output window at the bottom. Scrolling a bit, we’ll find the line Using , which indicates that this version of IDA does indeed recognize Visual C++ compilers from 7 through 14.

Let’s break down the resulting listing. The first—and in this case the only—thing we need to find is the main function, main. At the start of the startup code, after the sub_406992 routine is executed, the program jumps to the label loc_406109:
.text:0040628B start proc near
.text:0040628B call sub_406992
.text:00406290 jmp loc_406109
To jump to a label, place the text cursor on it and press Enter. If you hover the mouse over a label or a function call, a popup will appear showing either the start of the selected function or the part of the listing the label points to, which is very convenient.
In this case, as the comment shows, IDA sent us to the beginning of the startup code. Let’s scroll down the listing a bit, keeping an eye on how control flows between the labeled locations.
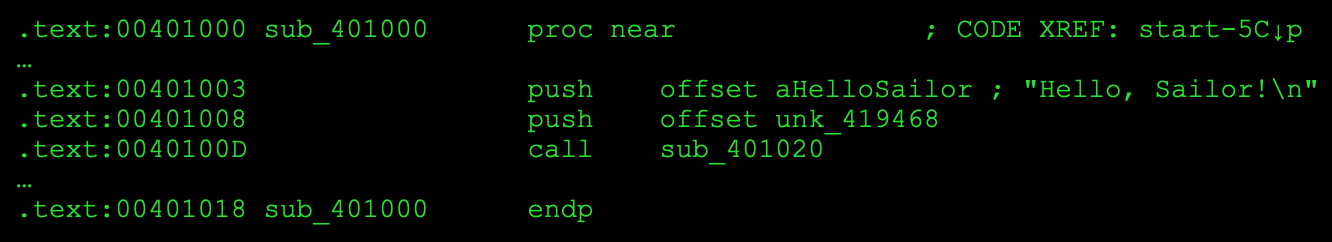
We eventually reach the function call: call . This appears to be the main function, since the disassembler recognized a string variable and assigned it a meaningful name, aHelloSailor, with the original content shown in the right-hand comment for clarity: Hello, . The compiler pushes the address of this string onto the stack, and then, a couple of lines below, it apparently calls a function that prints it to the screen.
.text:004010D3 push offset aHelloSailor ; “Hello, Sailor!\n”
.text:004010D8 push offset unk_42DE30
.text:004010DD call sub_401170
To confirm that, let’s dive into the last routine. It’s nearly impossible to make sense of it, except that the sheer number of parameters hints at a resemblance to the printf function.
If you place the cursor anywhere inside the name aHelloSailor and press Enter, IDA will automatically jump to the line where that variable is defined:
.rdata:0041E1A0 aHelloSailor db ‘Hello, Sailor!’,0Ah,0 ; DATA XREF: sub_4010D0+3↑o
The notation DATA is a cross-reference. It indicates that at offset +3 within the function sub_4010D0 there’s a reference to this address, and the reference type is “offset” (o stands for offset). The upward arrow shows the source of the cross-reference is located above the current line.
If you place the cursor on sub_4010D0+3↑o and press Enter, IDA Pro will jump to the following line:
.text:004010D3 push offset aHelloSailor ; “Hello, Sailor!\n”
Pressing Esc undoes the last movement and returns the cursor to its original position.
For what it’s worth, the W32Dasm disassembler couldn’t even recognize the string variable.
What’s wrong with IDA?
Honestly, I was a bit disappointed—I’d expected IDA to recognize more library functions. So I pointed IDA at the same program compiled with an older toolchain. The guinea pig was Visual C++ 8.0 (VS 2005).
Let’s compare the compilers’ output. Using the same source code, compiled from the command line (folder first05). Load the resulting executable into IDA. The listing is shown in abbreviated form to save space.
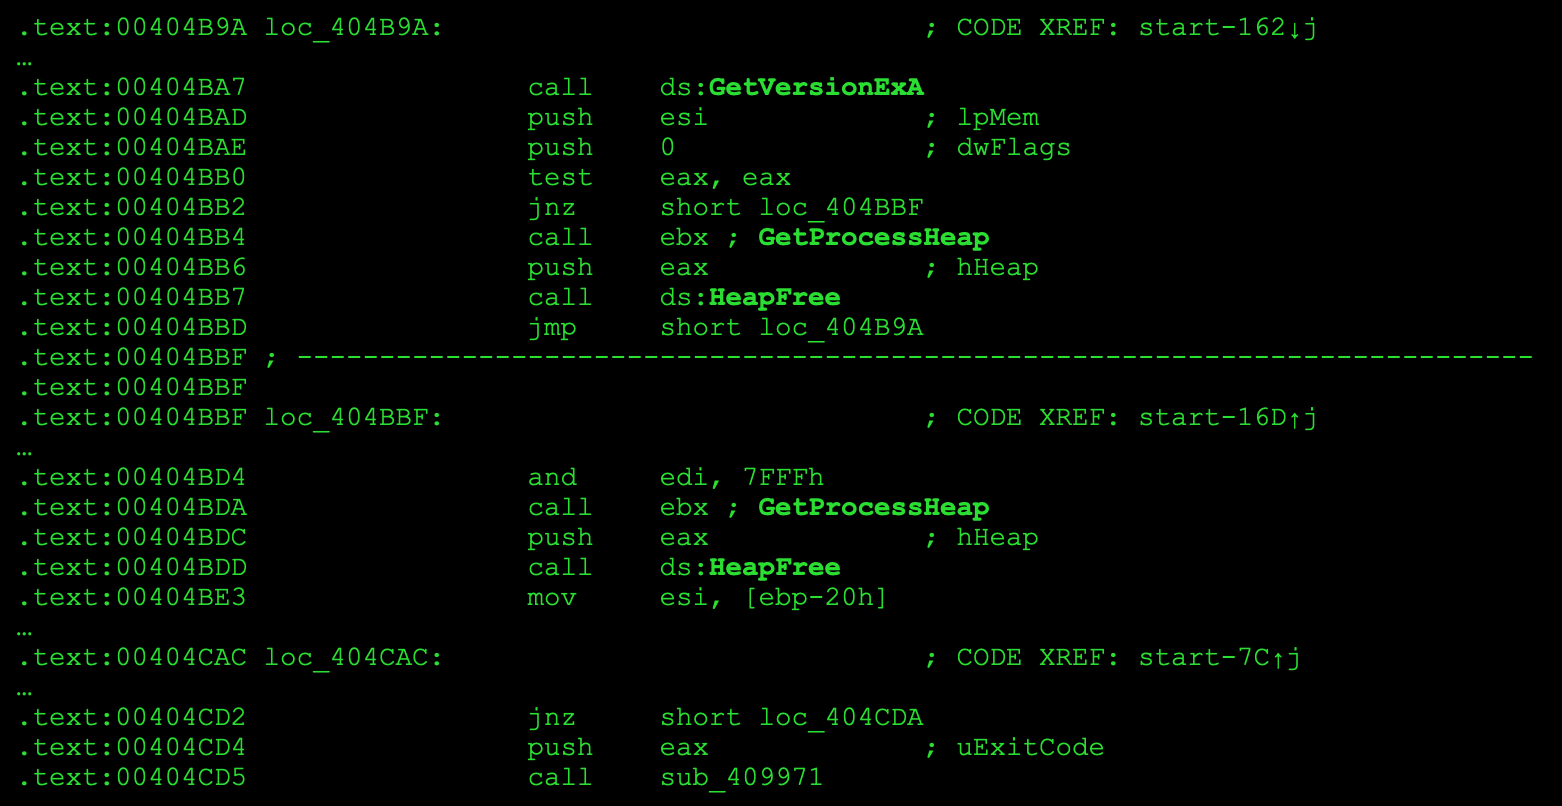
Not only is the startup code smaller, but more library functions were automatically identified—among them GetVersionExA, GetProcessHeap, HeapFree, and several others. With those in place, it’s easy to locate the call to main and navigate to the function itself.
That said, VC++ 8.0 is ancient history—I mentioned it only for illustration.
At this point, the analysis of first. is complete. For completeness, rename the function sub_4010D0 to main. To do this, position the cursor at . (the start of the function) and press N. In the dialog that appears, enter main. The result should look like this:
.text:004010D0 ; int __cdecl main(int argc, const char **argv, const char **envp)
.text:004010D0 main proc near ; CODE XREF: start-8D↓p
.text:004010D0
.text:004010D0 argc = dword ptr 8
.text:004010D0 argv = dword ptr 0Ch
.text:004010D0 envp = dword ptr 10h
.text:004010D0
.text:004010D0 push ebp
.text:004010D1 mov ebp, esp
.text:004010D3 push offset aHelloSailor ; “Hello, Sailor!\n”
.text:004010D8 push offset unk_42DE30
.text:004010DD call sub_401170
.text:004010E2 add esp, 8
.text:004010E5 xor eax, eax
.text:004010E7 pop ebp
.text:004010E8 retn
.text:004010E8 main endp
Note: IDA added the function prototype as a comment, and below it the default arguments.
IDA and Encrypted Executables
Another important advantage of IDA is its ability to disassemble encrypted programs. In the Crypt00. example, static encryption is used, which is common in wrapper-style protectors. Meanwhile, this file won’t run on Windows 10, because *.com programs require a 16-bit execution environment.
I don’t think that’s a reason to skip analyzing such an interesting case—especially since we have powerful virtualization tools, so spinning up a 32‑bit Windows XP that runs 16‑bit programs is no problem. Besides, analyzing .com files is much easier than .exe files, since the former are much smaller.
We’ve already seen the impenetrable thicket of compiler-injected library code even in a tiny EXE, whereas a COM binary keeps things to the bare minimum—as we’ll soon confirm. Also note that the last version of IDA Pro that runs on 32-bit systems was 6.8.

The encryption technique under discussion completely “blinds” most disassemblers. For example, when the file Crypt00. is processed with Sourcer, the output looks like this:
This is a tiny self-decrypting DOS routine. It XOR-decodes the bytes starting at offset 010D with the key 0x77 up to 0124, modifying its own code and data in place. After decoding, execution falls through into the now-decrypted code (the original RET at 010D turns into real instructions).
What it decrypts into:
– mov ah, 09h
– mov dx, 0115h
– int 21h
– ret
– “Hello, World!\r\n$”
So the routine decodes itself and a string, then uses DOS int 21h, function 09h to print “Hello, World!” followed by CRLF, with the standard “$” string terminator.
Sourcer failed to disassemble about half the code, leaving it as a raw dump. And there isn’t much we can do to help it. By contrast, IDA was designed from the ground up as a user-friendly interactive environment. Unlike Sourcer-style disassemblers, IDA makes no silent assumptions and, when it hits ambiguity, it asks the user for guidance. IDA’s analysis of the file Crypt00. looks like this:
seg000:0100 public start
seg000:0100 start proc near
seg000:0100 mov si, 10Dh
seg000:0103
seg000:0103 loc_10103: ; CODE XREF: start+B↓j
seg000:0103 xor byte ptr [si], 77h
seg000:0106 inc si
seg000:0107 cmp si, 124h
seg000:010B jbe short loc_10103
seg000:010D retn
seg000:010D start endp
seg000:010D
seg000:010D ; —————————————–
seg000:010E db 7Eh, 0CDh, 62h, 76h, 0BAh, 56h, 0B4h, 3Fh, 12h, 2 dup(1Bh)
seg000:010E db 18h, 5Bh, 57h, 20h, 18h, 5, 13h, 56h, 7Ah, 7Dh, 53h
seg000:010E seg000 ends
seg000:010E
seg000:010E
seg000:010E end start
At this point, you need to give the disassembler a hand. Newcomers typically move the cursor to the relevant line and press C, making IDA disassemble the code from the current address to the end of the function. It may look like the obvious fix, but it’s the wrong one.
Data
In the line at 0x100, is 10Dh a constant or an offset? Clearly, SI is loaded with an offset, because later the memory operand at that offset is treated as a byte and an XOR operation is performed on it.
To convert the immediate to an offset, place the text cursor on 10Dh and press O. The disassembly will then look like this:
seg000:0100 mov si, offset locret_1010D
…
seg000:010D locret_1010D: ; DATA XREF: start+B↑o
seg000:010D retn
seg000:010D start endp
seg000:010D
seg000:010D ; —————————————–
seg000:010E db 7Eh, 0CDh, 62h, 76h, 0BAh, 56h, 0B4h, 3Fh, 12h, 2 dup(1Bh)
seg000:010E db 18h, 5Bh, 57h, 20h, 18h, 5, 13h, 56h, 7Ah, 7Dh, 53h
seg000:010E seg000 ends
IDA Pro automatically created a new name, locret_1010D, which points to an encrypted code block. Let’s try converting it to data. To do this, place the cursor at address 010D and press D twice to confirm the prompt in the popup dialog. The listing will look like this:
…
seg000:010D word_1010D dw 7EC3h ; DATA XREF: start↑o
seg000:010F db 0CDh ; =
seg000:0110 db 62h ; b
seg000:0111 db 76h ; v
seg000:0112 db 0BAh ; ¦
seg000:0113 db 56h ; V
seg000:0114 db 0B4h ; +
seg000:0115 db 3Fh ; ?
seg000:0116 db 12h
seg000:0117 db 1Bh
seg000:0118 db 1Bh
seg000:0119 db 18h
seg000:011A db 5Bh ; [
seg000:011B db 57h ; W
seg000:011C db 20h
seg000:011D db 18h
seg000:011E db 5
seg000:011F db 13h
seg000:0120 db 56h ; V
seg000:0121 db 7Ah ; z
seg000:0122 db 7Dh ; }
seg000:0123 db 53h ; S
seg000:0123 seg000 ends
But what exactly is word_1010D pointing to? We can figure that out by looking at the following code:
seg000:0100 start proc near
seg000:0100 mov si, offset word_1010D
seg000:0103
seg000:0103 loc_10103: ; CODE XREF: start+B↓j
seg000:0103 xor byte ptr [si], 77h
seg000:0106 inc si
seg000:0107 cmp si, 124h
seg000:010B jbe short loc_10103
seg000:010B start endp
Once the offset is loaded into the SI register, a loop starts that acts as a simple decoder: SI points to the current character, and an XOR with 0x77 decodes one byte (one ASCII character). Recall that in assembly, hexadecimal numbers can be written as 77h. After that, SI is incremented (the pointer advances to the next character) and the updated value is compared to 0x124, which is the total number of characters to decode.
At this point, pause and scroll down through the disassembly to find the largest offset. We see it’s 0x123. The encrypted data region might extend to the end of the program; however, this offset is still smaller than the total number of bytes we need to decrypt.
Let’s expand the segment of our test program. Press Shift+F7 (View → Open subviews → Segments) to open the Program Segmentation tab. In the context menu of the only existing segment seg000, choose Edit Segments (Ctrl+E). In the dialog, enter a larger value in the End address field, for example 0x10125. Confirm your choice in the prompt that appears.

Take a look at the expanded segment. Back to the code. If, after the comparison, the value in the SI register is less than or equal to the total number of bytes, execution jumps to the label loc_10103 and the block repeats to decrypt the next byte. From this we can conclude that word_1010D points to the start of the byte sequence to be decrypted. Place the cursor on it, press N, and give it a meaningful name, for example BeginCrypt. And the 124h constant can first be converted to an offset (Ctrl-O) and then renamed, for example to EndCrypt.
Decryption
Direct disassembly of encrypted code isn’t possible—you have to decrypt it first. Most disassemblers can’t modify the code under analysis on the fly, so the target file must be fully decrypted before you load it into the disassembler.
In practice, though, it works a bit differently. Before you can decrypt anything, you need to determine the decryption routine by analyzing the accessible part of the file. Then you exit the disassembler, decrypt the “secret” block by whatever means, reload the file into the disassembler (losing your previous disassembly results), and continue the analysis until you encounter another encrypted fragment. The cycle—exit the disassembler → decrypt → reload → analyze—then repeats.
The strength of IDA is that it lets you do the same job with much less effort, without ever leaving the disassembler. It achieves this thanks to its virtual memory mechanism. Without getting into the weeds, you can think of IDA as a transparent virtual machine that operates on the computer’s physical memory. To modify memory locations, you need to know their address.
To the left of each line you’ll see the segment name and its offset, for example seg000:. But that’s not the value we need. Place the text cursor on the desired line and look at the bottom of the current tab (I assume that’s IDA View-A for you).

As you move the cursor, the corresponding offset changes as well (it’s boxed in the figure above). You can use this offset to address any byte in the segment. To read and modify bytes, use the Byte and PatchByte functions, respectively. For example, a call might look like this: a=Byte( reads the byte at offset 0x01010D; PatchByte( writes the value 0x27 to the memory byte at offset 0x01010D. As their names suggest, these functions operate on single-byte locations.
Knowing C and these two functions is enough to write a decryption script.
IDA-C’s implementation doesn’t fully conform to the standard. In particular, IDA doesn’t let you specify a variable’s type; it infers the type from the variable’s first use, and declarations use the auto keyword. For example, auto declares two variables: MyVar and s0.
To create a script, press Shift+F2 or choose Script Command from the File menu. This opens the Execute Script window. Most of the window is taken up by a list of scripts and an input area where you can edit the selected script.
Additionally, at the bottom of the window there’s a drop-down for selecting the scripting language (IDC or Python), a drop-down for setting the tab width, and four buttons: Run (execute the script), Export (save the script to a file), Import (load a script from a file), and Save (store the script in the project’s database).
When you open the window for the first time, the script list selects the “Default snippet” by default. For its body, enter the following code:
auto a, x;for (a = 0x01010D; a <= 0x010123; a++) { x = Byte(a); x = (x ^ 0x77); PatchByte(a, x); Message(x);}
As shown above, the decryptor’s algorithm essentially iterates over the encrypted block, applying XOR to each byte:
seg000:0103 xor byte ptr [si], 77h
The encrypted segment itself starts at address 0x01010D and continues up to 0x010123.
Finally, with the Message command, we send the modified character to IDA’s output window.
To run the script, simply click the Run button. If you didn’t make any typos while entering the script, the output will look like this:
…
seg000:010D BeginCrypt dw 9B4h ; DATA XREF: start↑o
seg000:010F db 0BAh ; ¦
seg000:0110 db 15h
seg000:0111 db 1
seg000:0112 db 0CDh ; =
seg000:0113 db 21h ; !
seg000:0114 db 0C3h ; +
seg000:0115 db 48h ; H
seg000:0116 db 65h ; e
seg000:0117 db 6Ch ; l
seg000:0118 db 6Ch ; l
seg000:0119 db 6Fh ; o
seg000:011A db 2Ch ; ,
seg000:011B db 20h
seg000:011C db 57h ; W
seg000:011D db 6Fh ; o
seg000:011E db 72h ; r
seg000:011F db 64h ; d
seg000:0120 db 21h ; !
seg000:0121 db 0Dh
seg000:0122 db 0Ah
seg000:0123 db 24h ; $
seg000:0124 EndCrypt db ? ; DATA XREF: start+7↑o
seg000:0124 seg000 ends
seg000:0124
seg000:0124
seg000:0124 end start
And the output window will display the message.
Hello, $
Possible issues include: case-sensitivity problems (IDA is sensitive to case), syntax errors, and incorrect block boundary addresses for the section being modified. If something goes wrong, place the cursor at address seg000:, press U (to clear the previous disassembly of the encrypted fragment), and then press C (to re-disassemble the decrypted code).
The characters in front of the “Hello, World!” string aren’t readable; most likely it’s not ASCII but executable code. Place the cursor on the line seg000: and press C (“Convert to instruction”). As a result, the listing will look like this:
…
seg000:010D BeginCrypt: ; DATA XREF: start↑o
seg000:010D mov ah, 9
seg000:010F mov dx, 115h
seg000:0112 int 21h ; DOS – PRINT STRING
seg000:0112 ; DS:DX → string terminated by ““
seg000:0114 retn
seg000:0114 ; —————————————
seg000:0115 db 48h ; H
seg000:0116 db 65h ; e
seg000:0117 db 6Ch ; l
seg000:0118 db 6Ch ; l
seg000:0119 db 6Fh ; o
seg000:011A db 2Ch ; ,
seg000:011B db 20h
seg000:011C db 57h ; W
seg000:011D db 6Fh ; o
seg000:011E db 72h ; r
seg000:011F db 64h ; d
seg000:0120 db 21h ; !
seg000:0121 db 0Dh
seg000:0122 db 0Ah
seg000:0123 db 24h ;
seg000:0124 EndCrypt db ? ; DATA XREF: start+7↑o
seg000:0124 seg000 ends
seg000:0124
seg000:0124
seg000:0124 end start
You can turn the character sequence starting at seg000: into a readable string by placing the cursor on it and pressing A. You can also convert the 115h constant on line 010F into an offset. Now the disassembler view will look like this:
…
seg000:010D BeginCrypt: ; DATA XREF: start↑o
seg000:010D mov ah, 9
seg000:010F mov dx, offset aHelloWord ; “Hello, Word!\r\n“
seg000:0112 int 21h ; DOS – PRINT STRING
seg000:0112 ; DS:DX -> string terminated by ““
seg000:0114 retn
seg000:0114 ; —————————————
seg000:0115 aHelloWord db ‘Hello, Word!’,0Dh,0Ah,’$’ ; DATA XREF: seg000:010F↑o
seg000:0124 EndCrypt db ? ; DATA XREF: start+7↑o
seg000:0124 seg000 ends
seg000:0124
seg000:0124
seg000:0124 end start
The instruction MOV at seg000: sets up register AH before invoking interrupt 0x21. It selects the DOS print-string function, and the string’s offset is loaded into DX by the next instruction. In other words, to assemble the listing successfully, you need to replace the constant 0x115 with the appropriate offset.
However, the string emitted at assembly time (before code relocation) lives in a completely different place! One way to address this is to create a new segment and copy the decrypted code into it. This effectively simulates relocating code in a running program.
Creating a New Segment
To create a new segment, open the Segments tab (Shift+F7) and press Insert. A window like this will appear.

The segment’s base address can be anything, as long as it doesn’t overlap seg000 or MySeg. Set the segment’s start so the first byte has an offset of 0x100. Make the new segment the same size as seg000. Don’t forget to set the segment type to 16-bit.
Next, we’ll proceed step by step. First, we’ll copy the instructions that print characters to the console. We’ll start reading bytes at offset 10D of the seg000 segment and insert them at the very beginning of the MySeg segment. You can do this with a script like the following:
auto a, x;for (a = 0x0; a < 0x8; a++) { x = Byte(0x1010D+a); PatchByte(0x20100+a,x);}To enter it again, press Shift+F2. To create another script, press Insert. After that, the disassembler screen will look like this (only the beginning of the MySeg segment is shown):
MySeg:0100 ; Segment type: Regular
MySeg:0100 MySeg segment byte public ” use16
MySeg:0100 assume cs:MySeg
MySeg:0100 ;org 100h
MySeg:0100 assume es:nothing, ss:nothing, ds:nothing, fs:nothing, gs:nothing
MySeg:0100 db 0B4h ; +
MySeg:0101 db 9
MySeg:0102 db 0BAh ; ¦
MySeg:0103 db 15h
MySeg:0104 db 1
MySeg:0105 db 0CDh ; =
MySeg:0106 db 21h ; !
MySeg:0107 db 0C3h ; +
MySeg:0108 db ? ;
You need to convert the data into instructions: place the cursor on the line MySeg: and press C. The disassembly will then look as expected:
MySeg:0100 mov ah, 9
MySeg:0102 mov dx, 115h
MySeg:0105 int 21h ; DOS – PRINT STRING
MySeg:0105 ; DS:DX → string terminated by “$”
MySeg:0107 retn
To make the cloned program behave a bit differently from its parent, we’ll add a wait for a keystroke. To do this, place the cursor on the retn instruction and choose Edit → Patch program → Assemble…
Type XOR and press Enter. Then INT , press Enter again. The final instruction is RET; press Enter, then Esc to close the dialog.

Now, using the following script, we’ll copy the bytes that make up the “Hello, World!” string:
auto a, x, i;i = 0;for (a = 0x0115; a < 0x124; a++) { x = Byte(0x10000+a); PatchByte(0x2010C+i,x); i++;}Place the cursor on the line MySeg:, press A to convert the byte sequence into a readable string. In the line MySeg:, change the constant 115h to the actual address where the output string is located: MySeg:. To do this, put the cursor on that line, open the Assemble Instruction dialog (Edit → Patch program → Assemble…), and enter MOV .
Now convert the constant 10Ch into an offset, and turn the byte sequence at that address into a human-readable string. You already know how to do that. Finally, I recommend a bit of cosmetic cleanup—shrink the segment to the required size. To get rid of any addresses that end up beyond the new end of the segment after shrinking, check the “Disable Address” option in the segment properties window.
It might seem like we can start assembling already, but don’t rush! Our program contains three offsets that serve as pointers. In the disassembled listing, they look perfectly fine:
-
movin segmentsi, offset BeginCrypt seg000; -
cmpin segmentsi, offset EndCrypt seg000; -
movin segmentdx, offset aHelloWord_0 MySeg.
Meanwhile, after assembly the symbolic names will be replaced with numeric constants. Will those offsets in the final program still point to the same things as in the original? Let’s analyze the listing again. The first offset, BeginCrypt, points to the line at seg000:. Essentially, all the preceding code will be copied, so its value doesn’t need to change. The second offset, EndCrypt, which points to the end of the segment, should increase by four bytes because we added two instructions:
seg000:0114 xor ax, ax
seg000:0116 int 16h
To calculate their size, just subtract their starting offset from the next offset: 118h – 114h = 4h bytes. As a result, EndCrypt should point to 124h + 4h = 128h. Place the cursor on the seg000: line, open the assembler window, and replace the instruction there with cmp .
The third offset, aHelloWord_0, in the original program is 10Ch. Let’s consider how the address should change. If aHelloWord_0 is located in the MySeg segment, we just need to add to the existing offset the size of the decoder in the seg000 segment. You can calculate it as the difference between the starting offset of the encrypted block and the starting address: 0x010D – 0x0100 = 0xD bytes.
As a result, the offset aHelloWord_0 should resolve to 0x10C + 0xD = 0x119. Let’s change the code: place the cursor on the MySeg: line and use the built-in assembler to modify it to mov .
As a result, the final listing looks like this:
seg000:0100 ; Segment type: Pure code
seg000:0100 seg000 segment byte public ‘CODE’ use16
seg000:0100 assume cs:seg000
seg000:0100 org 100h
seg000:0100 assume es:nothing, ss:nothing, ds:seg000, fs:nothing, gs:nothing
seg000:0100
seg000:0100 ; =========== S U B R O U T I N E ================
seg000:0100
seg000:0100
seg000:0100 public start
seg000:0100 start proc near
seg000:0100 mov si, offset BeginCrypt
seg000:0103
seg000:0103 loc_10103: ; CODE XREF: start+Bj
seg000:0103 xor byte ptr [si], 77h
seg000:0106 inc si
seg000:0107 cmp si, 128h
seg000:010B jbe short loc_10103
seg000:010B start endp
seg000:010B
seg000:010D
seg000:010D BeginCrypt: ; DATA XREF: starto
seg000:010D mov ah, 9
seg000:010F mov dx, offset aHelloWord ; “Hello, Word!\r\n“
seg000:0112 int 21h ; DOS – PRINT STRING
seg000:0112 ; DS:DX -> string terminated by ““
seg000:0114 retn
seg000:0114 ; ————————————————
seg000:0115 aHelloWord db ‘Hello, Word!’,0Dh,0Ah,’‘ ; DATA XREF: seg000:010Fo
seg000:0124 EndCrypt db ?
seg000:0124 seg000 ends
seg000:0124
MySeg:0100 ; ————————————————
MySeg:0100
; ===========================================================
MySeg:0100
MySeg:0100 ; Segment type: Regular
MySeg:0100 MySeg segment byte public ” use16
MySeg:0100 assume cs:MySeg
MySeg:0100 ;org 100h
MySeg:0100 assume es:nothing, ss:nothing, ds:nothing, fs:nothing, gs:nothing
MySeg:0100 mov ah, 9
MySeg:0102 mov dx, 119h
MySeg:0105 int 21h ; DOS – PRINT STRING
MySeg:0105 ; DS:DX -> string terminated by ““
MySeg:0107 xor ax, ax
MySeg:0109 int 16h ; KEYBOARD – READ CHAR FROM BUFFER, WAIT IF EMPTY
MySeg:0109 ; Return: AH = scan code, AL = character
MySeg:010B retn
MySeg:010B ; ————————————————
MySeg:010C aHelloWord_0 db ‘Hello, Word!’,0Dh,0Ah,’$’
MySeg:011B db ? ;
MySeg:011B MySeg ends
MySeg:011B
MySeg:011B
MySeg:011B end start
Creating a Clone
The resulting listing is convenient for analysis, but it’s still not ready to be assembled—if only because no assembler can produce the required encrypted code. Sure, you could do that step manually after the build, but you can achieve the same result right in IDA without relying on any external tools.
To solve this, we’ll write a script that automatically copies and encrypts the required parts of the program:
auto a, f, x;// The file crypt01.com is opened for writing in binary modef = fopen("crypt01.com", "wb");// Copy the decryptorfor (a = 0x10100; a < 0x1010D; a++) { x = Byte(a); fputc(x, f);}// The entire MySeg segment is copied and encrypted on the flyfor (a = SegStart(0x20100); a != SegEnd(0x20100); a++) { x = Byte(a); x = (x ^ 0x77); fputc(x, f);}// The file is closedfclose(f);The vast majority of viruses use a similar technique: copying their own code into another file.
Results
Running the script will create a file named crypt01.. Launch it to verify it works: it prints a line to the screen and exits after you press any key.

A major advantage of this approach is pass-through compilation of the file: the disassembled listing isn’t actually reassembled. Instead, the original bytes are read from virtual memory and written out as-is, so apart from the lines you modified, the output is byte-for-byte identical to the original file. In contrast, reassembling almost never produces a bit-for-bit match with the file you disassembled.
Disassembler and Debugger in Tandem
The disassembler bundled with a debugger is usually pretty rudimentary and lacks advanced features. In particular, the one built into WinDbg isn’t much better than DUMPBIN, with all the shortcomings we’ve already run into. What a difference it makes when you load the code into IDA!
Why is a debugger valuable, then? Because a disassembler, by its very static nature, has inherent limitations. For one, the analyst ends up “running” the program on a mental CPU emulator, which means they need to know the semantics of every processor instruction and all the operating system’s internal structures—including the undocumented ones.
Second, starting analysis from an arbitrary point in a program isn’t that simple—you need to know the current contents of registers and memory, and how are you supposed to get those? With registers and local variables it’s not so bad—you can just scroll up in the disassembly and see where their values are assigned. But that trick won’t work for global variables, which can be modified by anything at any time. If only we could set a breakpoint… but what kind of breakpoint can you have in a disassembler?
Third, disassembly forces you to reconstruct the algorithm behind every function, whereas debugging lets you treat a function as a black box with inputs and outputs. Say there’s a routine that decrypts the program’s main module. In a disassembler, you’d first have to figure out the encryption/decryption algorithm (which can be anything but trivial), then reimplement that function in IDA C (IDC), debug it, and run the decryptor. In a debugger, you can just let the CPU execute the function without caring how it works and, once it finishes, continue analyzing the now‑decrypted module.
The list could go on, but it’s already clear that a debugger isn’t a competitor to a disassembler—it’s a partner. Seasoned reverse engineers always use these tools together: you reconstruct the algorithm in the disassembler, and any unclear parts are quickly verified by running the program under a debugger.
Naturally, you’ll want the debugger to show all the symbol names you’ve assigned in the disassembly listing. IDA Pro offers two ways to do this. Let’s look at both.
Method 1
Let’s go back to Windows 10 and load the file first. into IDA Pro (or the previously created IDA project). From the File menu, select Produce file, then choose Create MAP file. A prompt will appear asking for the file name (enter, for example, first.), followed by a modal dialog asking which names to include in the MAP file. Press Enter to keep all options at their default settings.
A moment later, a file named first. is created on disk, containing all the necessary debug information in the Borland MAP format. WinDbg doesn’t support this format, so before you can use it in WinDbg you need to convert the file to the DBG format—Microsoft’s debug format.
You can do the conversion with the map2dbg utility, which is freely available along with its source code. Run it from the command line. Put the .map file and the corresponding .exe in the same directory. Then, in our case, run: map2dbg .
As a result, the tool will output the number of converted symbols, and a new file with the .dbg extension will be created in the current folder. You can now load first. into WinDbg. If first. is in the same directory, it will be picked up automatically and copied to the system folder C:\ for further analysis of the executable.
Now in WinDbg, run the . command. It forces the debugger to reload module information. Then run lm to see the list of loaded modules. The first module should be marked as CodeView symbols; otherwise it would show as deferred.
00400000 0041d000 first C (codeview symbols) C:\ProgramData\Dbg\sym\first.dbg\5D5D59DE1d000\first.dbg
Running the command x will list all symbols in the first. module (only a small portion of the list is shown):
…
004028c4 first!std::
00402913 first!std::
0040298e first!std::
00402a57 first!std::
00402a9e first!std::00402adb 00402af6 00402b12 00402b30 00402b5b 00402bc5 00402c29 00402c70 00402c90
…
Let’s look at the contents of the environment variable:
0:000> da first!aSouthAfrica
00415500 “south-africa”
Method 2
In the second approach, the debugger and disassembler switch roles, meaning the disassembler will leverage the debugger’s features. First, note that the free version of IDA does not support debugging. Second, and equally important: the path to the program being debugged must not contain Cyrillic characters.
warning
The free version of IDA Pro has other drawbacks as well: it mishandles generating output files (including the MAP file), builds graphs incorrectly, and has other issues we haven’t covered yet.
You can now connect WinDbg to IDA. To do this, open the configuration file ida. located in C:\. Scroll down until you find the following line:
//DBGTOOLS = "C:\\Program Files\\Debugging Tools for Windows (x86)\";
Enter the path to the WinDbg Debugging Tools below (or replace the existing one). In my case:
DBGTOOLS = "C:\\Program Files (x86)\\Windows Kits\\10\\Debuggers\\x64\";
Which brings us to the third takeaway: with IDA 7.0 and newer, even if you disassemble and debug the app using the 32-bit build of IDA, you must specify the path to the 64-bit WinDbg. Otherwise, you’ll get an error when you try to start debugging.
The next step is to launch IDA, select WinDbg from the toolbar drop-down, and press F9 to start debugging. However, the debugging session for first. will end almost immediately. We need the program to pause at its entry point. To do that, open the Debugger setup dialog (Debugger → Debugger options).

The Events tab is what we need. Here you can choose which events should suspend the program. Enable the third checkbox, “Suspend on process entry point,” so execution pauses at the startup code.

Look familiar? You bet. Note that the program operates on x86-64 CPU registers—RCX, RDX, RDI, and so on. The Windows 10 kernel exports 1,595 symbols, including all updates currently installed on my system.
You can check this by double-clicking the kernel32. module in the Modules window while debugging in IDA Pro. This opens an additional tab, Module: KERNEL32.DLL, which you can undock and drag anywhere. Along the bottom of the window, you’ll see the total number of symbols exported by that module.
Hooking up WinDbg to IDA lets IDA pull symbol information for modules from Microsoft’s public symbol server. You can either create an environment variable or set the directory directly in IDA without restarting it. We’ll take the second, quicker route—you can set up the environment variable later if you like. In IDA’s command line (at the bottom of the window, next to the WINDBG button), enter:
.
After that, reload the symbols with the . command. The number of symbols exported by the kernel32. module is now 5,568.
Symbol names now not only appear on screen, making the code easier to understand—you can also set breakpoints on any of them quickly and easily (e.g., bp ), and the debugger will know exactly what you mean. No more memorizing those hard-to-remember hex addresses!
Conclusion
IDA is a very handy tool for modifying files whose source code has been lost or is unavailable. It’s practically the only disassembler capable of analyzing encrypted programs without resorting to third‑party tools. It also features a mature user interface and intuitive navigation through the code under analysis. With a tool like this, you can tackle just about any conceivable task—provided, of course, you’re fluent in its scripting language, as the examples above demonstrate.