warning
This article is for informational purposes and intended for security professionals conducting tests under a contractual engagement. The author and editors cannot be held liable for any harm resulting from the use of the information provided. Distributing malware, disrupting systems, and violating the confidentiality of communications are punishable by law.
The Saga of Packers and Protectors
One of malware authors’ favorite tricks is the use of executable packers and protectors (this applies to DLLs too). Originally, these tools were fairly mundane: packers mostly reduced the size of the compiled file, while protectors let developers add licensing and anti-tamper features—turning a build into a demo or trial, for example—without cluttering the main codebase. Later, however, virus writers repurposed them for malicious ends.
Malware authors have long used packers to complicate antivirus and heuristic analysis, prevent their creations from running in virtualized environments, and hinder debugging, disassembly, and subsequent analysis. As a result, the ability to unpack executables has become a must-have skill for both novice and seasoned reverse engineers. The most popular packers today are UPX, ASPack, PeShield, and VMProtect—the usual suspects analysts encounter every day.
Protectors, unlike packers, are designed to shield the original binary from reverse engineering and therefore use more sophisticated techniques than simple packers: obfuscation; encryption with custom or well-known cryptographic algorithms such as RSA-1024; and embedding anti-debugging features.
As we know, to get to the code we actually want to analyze, you first have to unpack the binary—strip off all the protective layers, restore the original entry point (OEP) and the import table, at the very least. Often unpacking is a routine, playbook task, but sometimes it turns into a creative process and a full-on hacking investigation—complete with cases of beer, cartons of cigarettes, and a few inches of scorched nerve endings.
Theory Primer
So, as we know, using packers/protectors/crypters makes reverse engineering much more difficult. Beyond that, malware authors can apply multiple layers of packing (so-called layered packing), use obscure or even fully custom tools (for those who want to roll their own, a brief primer), whose signatures won’t show up in utilities like PEiD. Interestingly, any packer not purpose-built for encrypting malware leaves a unique signature in the binary, so if you’re comfortable with hex editors you can identify it even without a PE analyzer.
Here’s the basic idea behind packers/protectors: when you launch an EXE, execution starts at the program’s entry point (EP)—the address where control is transferred after the OS loads it into memory. With a packed executable, this flow changes. The packer records the EP, then compresses the file’s contents (typically the code and data sections), appends its own stub around the compressed payload, and redirects execution not to the program’s main code but to the packer’s code—the unpacker stub. That unpacker stub, now embedded in the file, runs first and inflates the packed code/data sections in memory. On disk, the original file remains unchanged—that is, still packed. After decompressing, the stub rebuilds the import table and then jumps to the program’s main code at the former entry point, which in packed binaries is called the Original Entry Point (OEP). In short, that’s the whole flow.
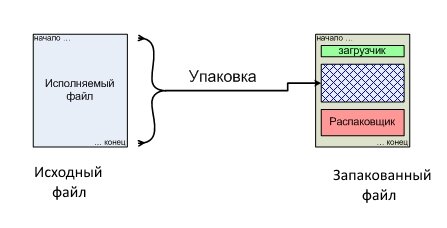
Data compression (packing) leverages information entropy, and the algorithms are essentially similar to those used by archivers—except that executable packers decompress the data directly in RAM.
Protectors, like some packers, employ various tactics to thwart dynamic unpacking—for example, decrypting code on the fly rather than all at once, or creating an image and unpacking it into memory just-in-time at startup. They can also use API calls to detect when their code is running under a debugger and then terminate; a common method is checking the result of the IsDebuggerPresent() API, which indicates whether the process is being debugged. In addition, protectors often add integrity checks for the original file, encrypt the import table, block memory dumps from specific virtual address ranges, and sometimes use poorly documented or undocumented APIs to resist tracing and the setting of hardware breakpoints.
Manual and automated unpacking
With a high probability, most live malware binaries will be packed with some kind of packer/protector. To confirm whether a file is packed, run PEiD or any other PE analyzer. In about 90% of cases that will be enough: PEiD has a large database of signatures and plugins, which lets you avoid extra hassle.
The next step is to perform file unpacking (restoration) to its original (“wild source”) form. There are a few ways to go about this. The first is to use auto-unpackers—tools purpose-built to automatically unpack a file based on a known packer/protector algorithm. For example, UN-PACK is an unpacker for UPX; ACKiller targets programs protected with ACProtect; Stripper handles files packed with ASProtect; and ASPack unp is for those wrapped with ASPack.
Another option is to use general-purpose unpackers such as QuickUnpack, RL!dePacker, or Dr.Web FLY-CODE Unpacker, which is based on the Dr.Web antivirus FLY-CODE engine. These tools automatically analyze the file, try to locate the OEP, and then dump the executable (often rebuilding the import table as well). However, it’s common for the dumped binary to be nonfunctional—either because the generic unpacker mishandled it, or because the packer’s algorithm has changed and is incompatible with what the unpacker expects. The upside is that even if you can’t get a fully working dump, the code section is often unpacked anyway, which is usually sufficient for analysis.
The third scenario—more time-consuming but ultimately more successful—is manual step-by-step unpacking with OllyDbg. If a file is packed with an unknown protector, you can often tell by the presence in the protected application’s import table of WinAPI functions from the Kernel32 library, such as GetProcAddressA, LoadLibraryA, or GetModuleHandle.
I recommend reading an article that gives a detailed rundown of all the analysis tools available today; it includes a brief description of each one and even provides download links.
Here’s a similar page, but this time it’s about unpackers.
info
Malware authors widely rely on packers and protectors to hinder detection and frustrate analysis. Most can be tackled with a standard reverse engineer’s toolkit, but some demand unconventional techniques and a deep understanding of Portable Executable (PE) internals.
How to conceal your debugger and bypass anti-debugging techniques
In one of our magazine articles, we covered the most useful OllyDbg plugins. The must-haves are:
- OllyExt — provides anti-anti-debugging options
- OllyDumpEx — a solid process dumper
- swordfish — quick breakpoint setup
- uberstealth — an anti-anti-debugging feature based on IDA Stealth code
Code Encryption
When analyzing various protection mechanisms, you often need to determine which algorithm was used to encrypt the data. Malware authors rarely reinvent the wheel; they typically rely on off‑the‑shelf encryption algorithms. If the algorithms are standard, they can often be recognized by telltale constants and polynomials, transformation tables, or the sequence of operations. There are dedicated tools for detecting cryptographic algorithms in executable files.
The most popular plugin is Krypto ANALyzer for PEiD. The detected values can be viewed directly or exported as a script for the IDA Pro disassembler.
Quick Analysis Guide
The usual workflow is straightforward: identify the packer signature, find the OEP, dump the program to disk, restore the import table, fix relocations, and rebuild the binary. If the file is not just packed but also protected, you may need extra steps, such as stripping junk instructions, bypassing anti-debugging techniques, and isolating or neutralizing CRC-based integrity checks.
A few words about dynamic libraries. Unpacking a DLL is almost the same as unpacking an EXE. Like EXEs, DLLs have a program entry point — an Entry Point created by the packer — and the original OEP. So you need to pause the DLL at the packer’s Entry Point, analyze from there, and step your way to the one true OEP of the DLL. After that, you can dump it as usual. And now a couple of short theory notes we’ll need today.
A Few Words About Breakpoints
Breakpoints are a widely used, indispensable tool for any reverse engineer. The primary modes are:
- break on read
- break on write
- break on execute at a specified address
The CALL $+5; POP reg pattern is typical of protection schemes, for example ones that copy themselves onto the stack. The frequently seen PUSHFD instruction shows up in self-tracing programs and anti-debugging protections.
OllyDbg supports several types of breakpoints:
- Regular breakpoint: replaces the first byte of the instruction you want to stop on with the INT3 instruction; can be set with F2 or via the context menu.
- Conditional breakpoint (Shift+F2): a standard INT3 breakpoint with an associated condition.
- Conditional breakpoint with logging (Shift+F4): a conditional breakpoint that can log the value of an expression or the parameters of a known function.
Cheat Sheet: Addressing Modes
A brief note on how to pass control to another part of the code.
Method 1:
jmp label
label:
mov eax,label
jmp eax
Method 2:
push label
retn
label:
Method 3:
call label
label:
Method 4:
stc
jc label
label:
Method 5:
mov cl,1
loop label
label:
All these examples may come in handy when locating the OEP.
A Quick Primer on the PE File Structure
A deep dive into the structure of a PE file is beyond the scope of this article, so we won’t get lost in the weeds. That said, we can’t skip it entirely, and understanding the fundamentals will pay off later.
As you can see, there’s a lot of theory on the internals of the PE format—and for good reason: its structure is fairly rich, and knowing your way around it enables deeper, more advanced analysis. That said, this topic is beyond the scope of our article, so we’ll keep it brief. Put simply, a PE file is an executable (EXE) that contains the actual code plus the data needed for the program to run correctly on the system. Typically, a PE’s contents are divided into several sections described in the header—think of it as the book’s table of contents. Let me highlight a couple of important nuances.
RVA and VA Values
RVA (Relative Virtual Address) stands for relative virtual address. It’s “relative” because it’s calculated as an offset from the module’s load address, which may or may not match the ImageBase.
RVA is calculated as follows:
RVA = VA – image base address
where VA (Virtual Address) is the element’s virtual address in memory, and the load address is taken from the OptionalHeader.ImageBase field if the image is loaded at its preferred ImageBase; otherwise, it is determined by the loader.
The general process for unpacking most files is as follows:
- Locate the OEP RVA.
- Dump the program from memory.
- Rebuild the import table.
- Restore the entry point to the original.
Understanding OEP
OEP (Original Entry Point) is the address where the program would start executing if it weren’t packed. Virtual Address (VA) is the virtual address of an item in memory. Relative Virtual Address (RVA) is the address relative to the ImageBase. For example, if we find an OEP of 00301000 and the ImageBase is 00300000, then the OEP’s RVA would be 1000. You can obtain the ImageBase value using any PE header editor.
Lab Environment
As before, we’ll run all our malware analysis experiments in our makeshift lab—a virtual machine with Windows XP preinstalled. The toolkit is basically the same every time; the only real difference is how often we use each tool.
Samples of the malware analyzed are included with the article. Be aware that when you unpack the lab archive, your antivirus will flag the files accordingly. Remember: backups are an admin’s best friend! Make backups before and after every experiment—this is especially easy with virtual machines: a couple of clicks and you’ve got a snapshot. It’ll save you a ton of time later—trust me, proven in practice.
warning
This article is for informational purposes and is intended for security professionals performing testing under a valid contract. Neither the author nor the editorial staff bears responsibility for any harm caused by the use of the information provided. The distribution of malware, disruption of systems, and violation of the confidentiality of communications are punishable by law.
malware01 Sample Analysis
Using this sample, we’ll walk through a basic workflow for initial file analysis: locating the OEP and the original (unpacked) code. After that, you can easily dump the file to disk and, for example, open it in IDA Pro to inspect the full import table.
Tools used:
- PEiD (DiE);
- OllyDbg v2;
- IDA Pro.
First, run a PE analyzer such as PEiD or DiE.
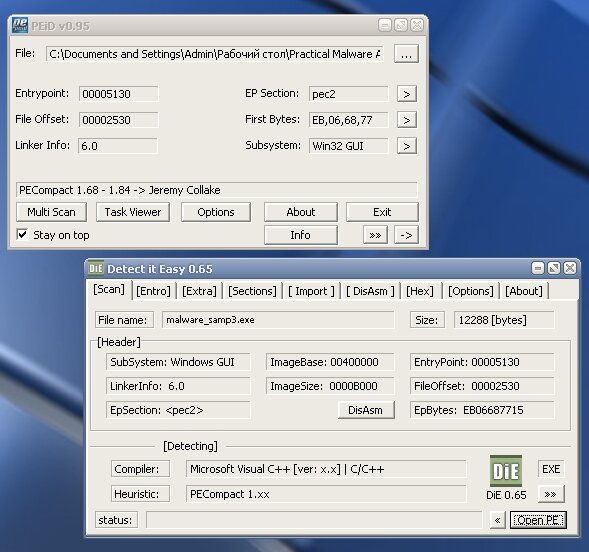
So we’re looking at a Win32 application, conveniently packed with PECompact, and the binary itself was compiled with Visual C++.
Next, fire up OllyDbg and drop in our sample. If the debugger complains that the file isn’t recognized because of a packer, just ignore it, click OK, and go ahead and load the file.
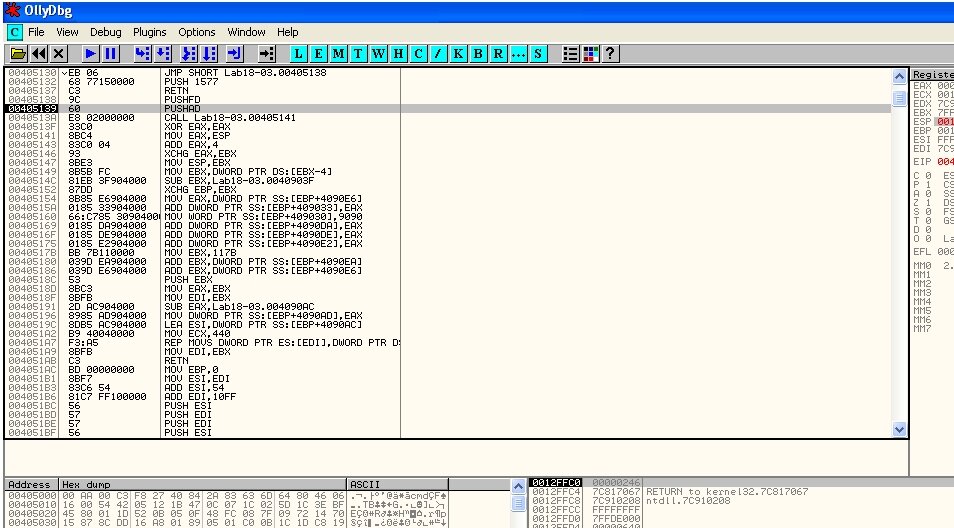
Our cursor lands at address 00405139 PUSHAD. In the right pane, we can view the current register values. Next, set a hardware on-access breakpoint on ESP; the line turns red. Press F9 a few times to run the program—when it hits our breakpoint, it halts. What do we see? The cursor stopped at 0045013A CALL malware01.00405141, which means that’s our main CALL.
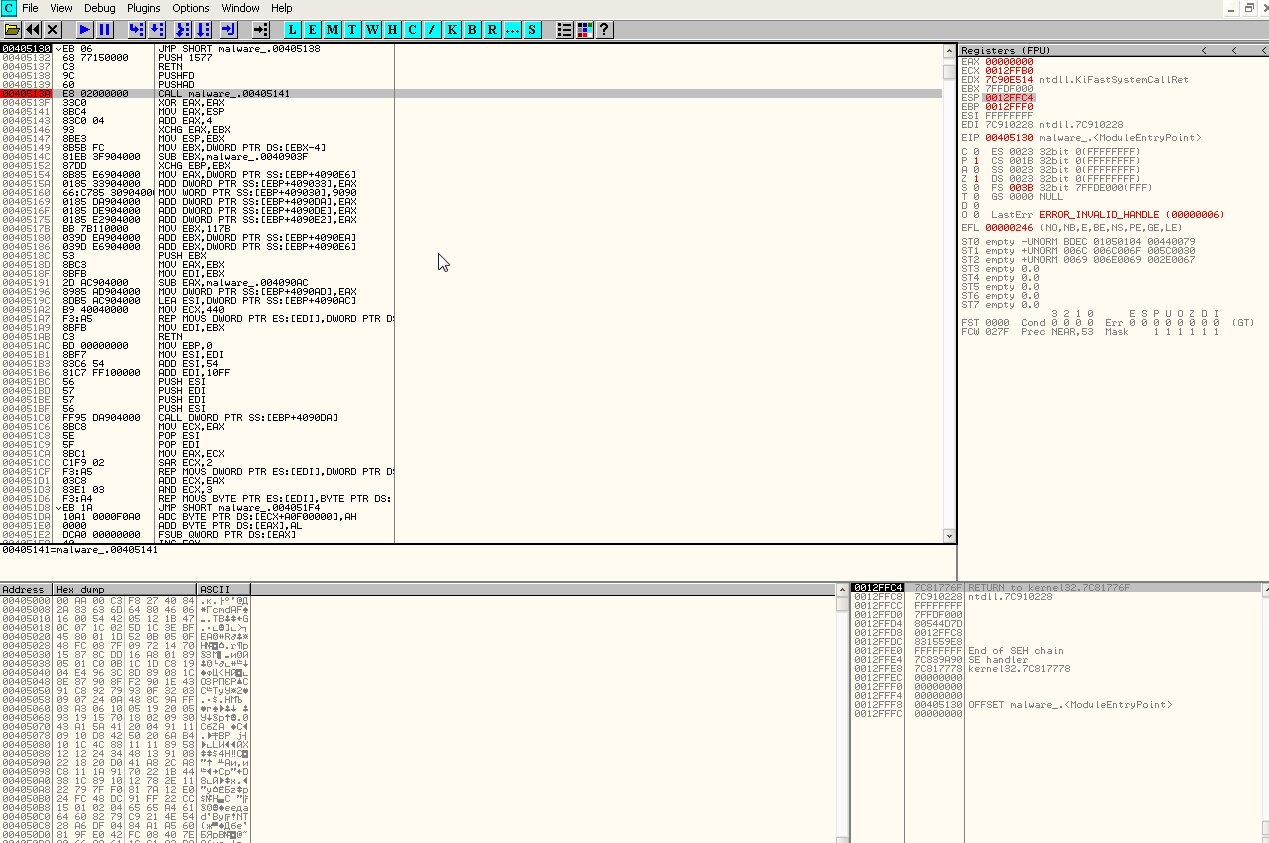
In the right-hand Registers pane, right-click the ESP value 0012FfA0 and select Follow in Dump. Then switch to the lower pane with the hex dump and, after selecting a few items, right-click and choose Breakpoint → Memory on access. Press F9 to run. Set another breakpoint: Breakpoint → Hardware on access → Dword. Execution will then stop at the POPAD instruction.
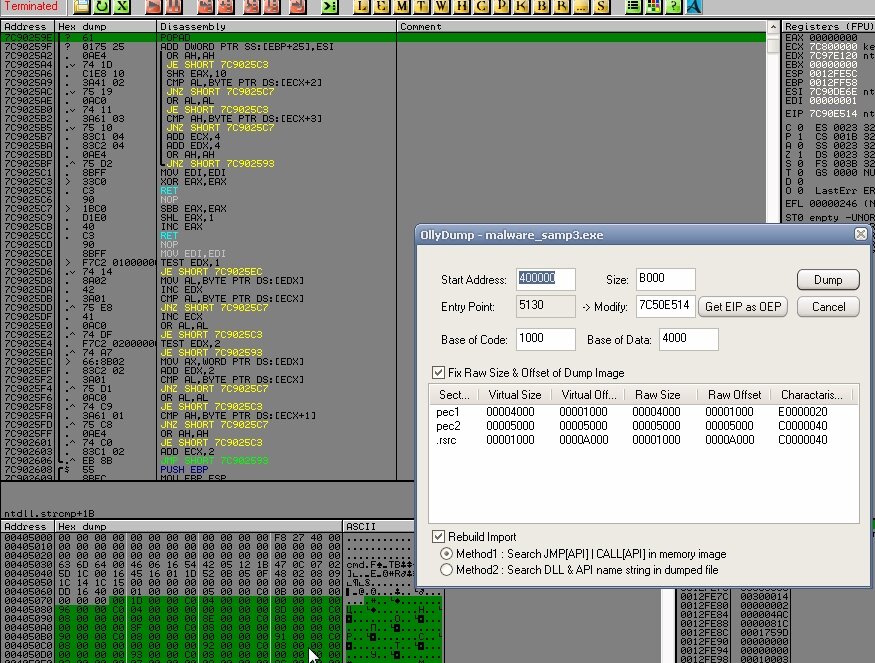
If we step back one stage, we’ll see the unpacked original code, but it will still be unreadable to us.
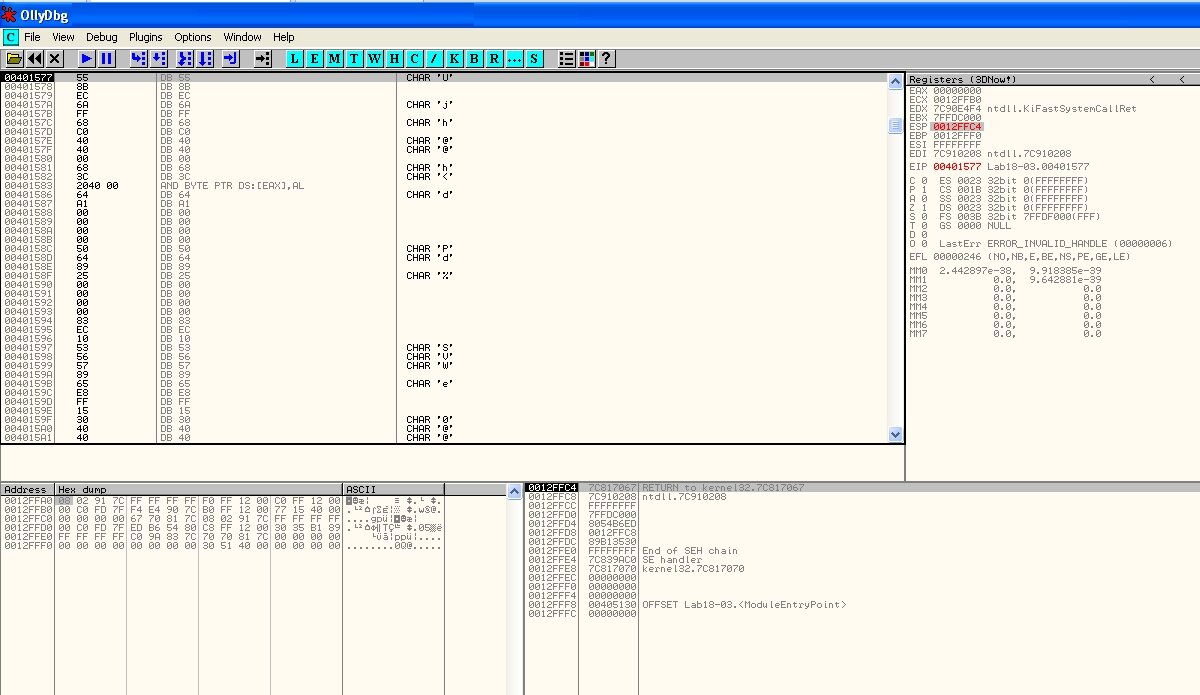
To fix this, press Ctrl+A and you’ll see the lines transform into a clear set of instructions right before your eyes.
After that, dump the process: open Plugins → OllyDump → Dump → Debugged process; in the dialog that opens, make sure to click Get EIP as OEP, then click Dump.
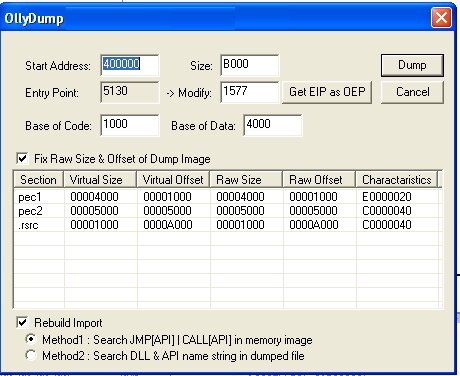
In the end, we have an unpacked binary that we can easily load into IDA Pro.
malware02 Sample Analysis
Now for a more challenging take on the previous sample: a corrupted PE header will make our lives harder. Still, there’s a way around it.
Tools used:
- PEiD;
- OllyDbg;
- Import REConstructor;
- IDA Pro.
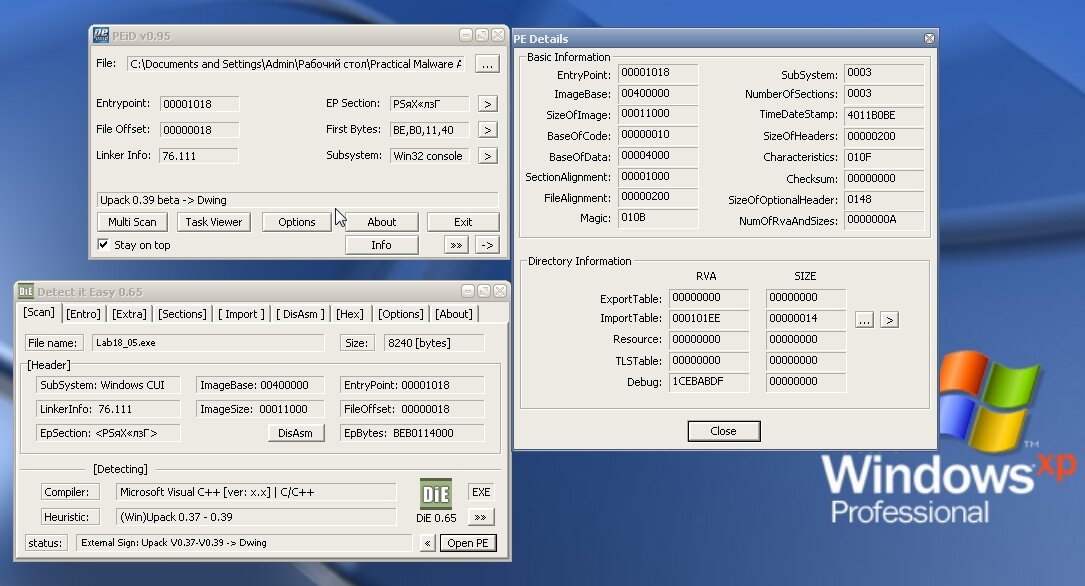
PEiD tells us the sample is packed with UPack.
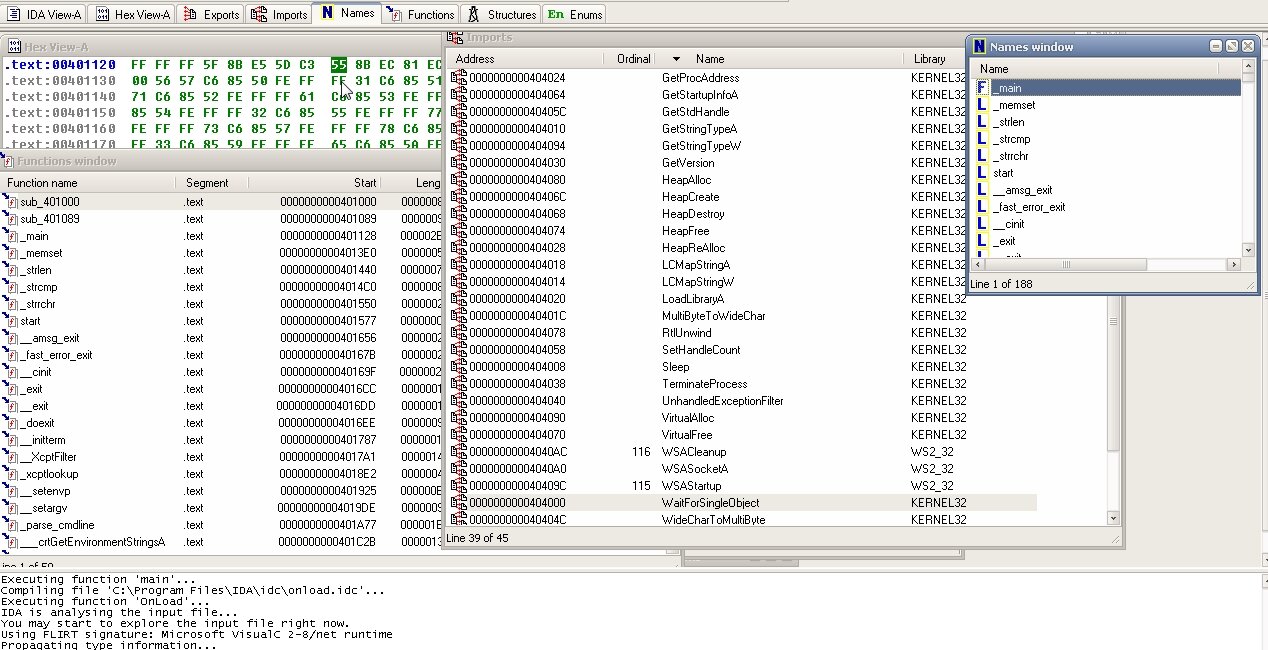
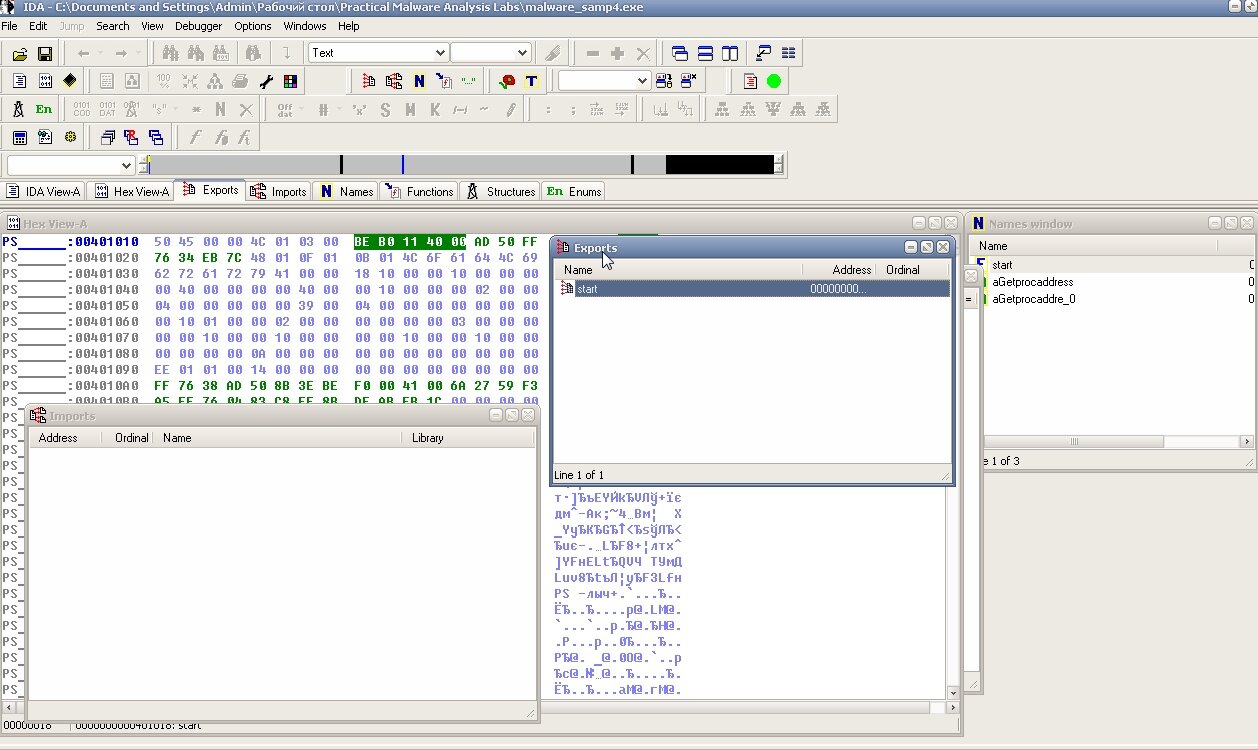
If you try to open it in IDA Pro, PEview, or in early versions of OllyDbg without plugins, you’ll get an “invalid/corrupt file” message. And in IDA Pro the opened file will have no import table at all; the only functions you’ll see are LoadLibraryA and GetProcAddress, which the packer uses to load the original code.
Neat trick, right? Open OllyDbg and load our file. Press Ctrl+G to open the search/go-to dialog, enter LoadLibraryA, jump to the corresponding line of code, and set a breakpoint with F2.
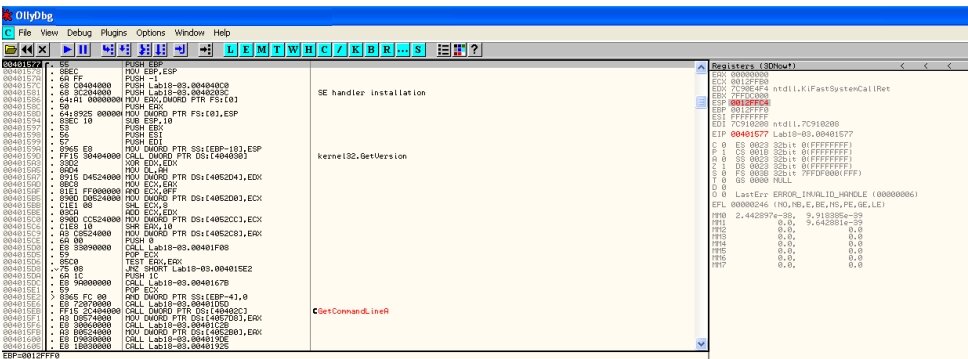
Run the program and you’ll see that right after kernel32.dll loads, advapi32.dll and commctrl.dll are pulled in as well. Break on the PUSH EBP instruction; in the right pane you’ll see calls to kernel32.GetVersion and kernel32.GetCommandLineA — voilà, you’ve landed in the unpacked original code.
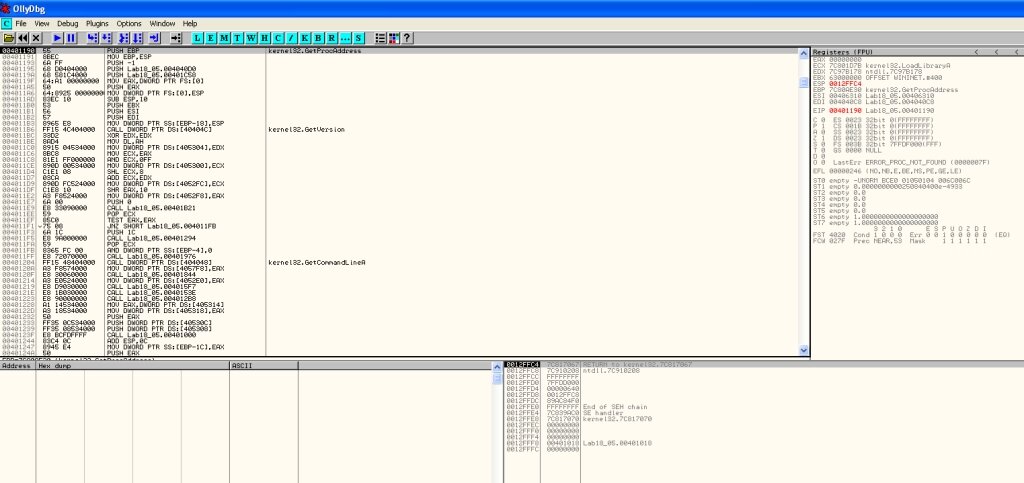
As in the previous case, we can dump the file, but if we do, the resulting dump will be corrupted. Remember I mentioned a broken PE header? That’s the culprit. In our case, we need to rebuild the Import Address Table (IAT) using Import REConstructor. Launch the tool, choose the target process from memory, then click IAT autosearch, Get Imports, and Fix Dump in that order.
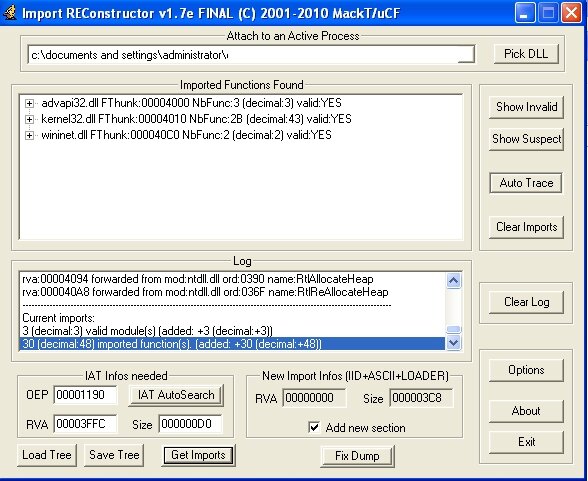
We’ve finally got the unpacked file, and from here we can do whatever we want with it.
Analyzing the malware03 sample
What should you do if you encounter malware packed with an unknown packer? The overall playbook still applies, but you’ll need to think creatively, look for new angles, and experiment. Below, we’ll go through a simple example of how to approach analysis when the file is packed with what the underground calls a “hacker packer.”
Tools used:
- PEiD;
- OllyDbg.
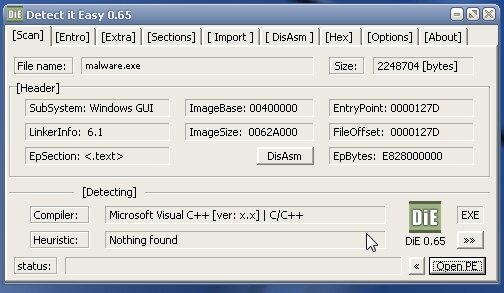
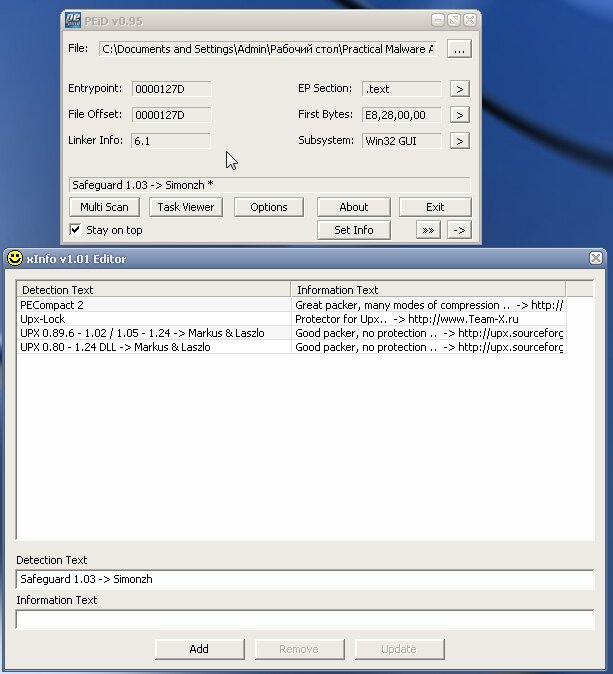
First, we run the PE analyzers PEiD/DiE/Pe-Scan—and what do we see? The file is packed. Even though PEiD did match a signature, it’s a non‑standard packer; it only shows up in the signatures because it’s already obsolete.
 |
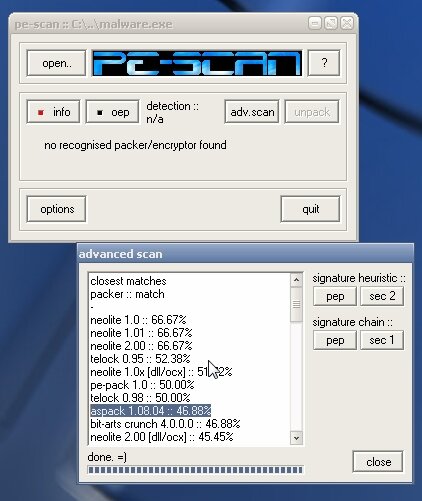 |
| Analysis in DiE and an attempt to identify the packer in Pe-Scan | |
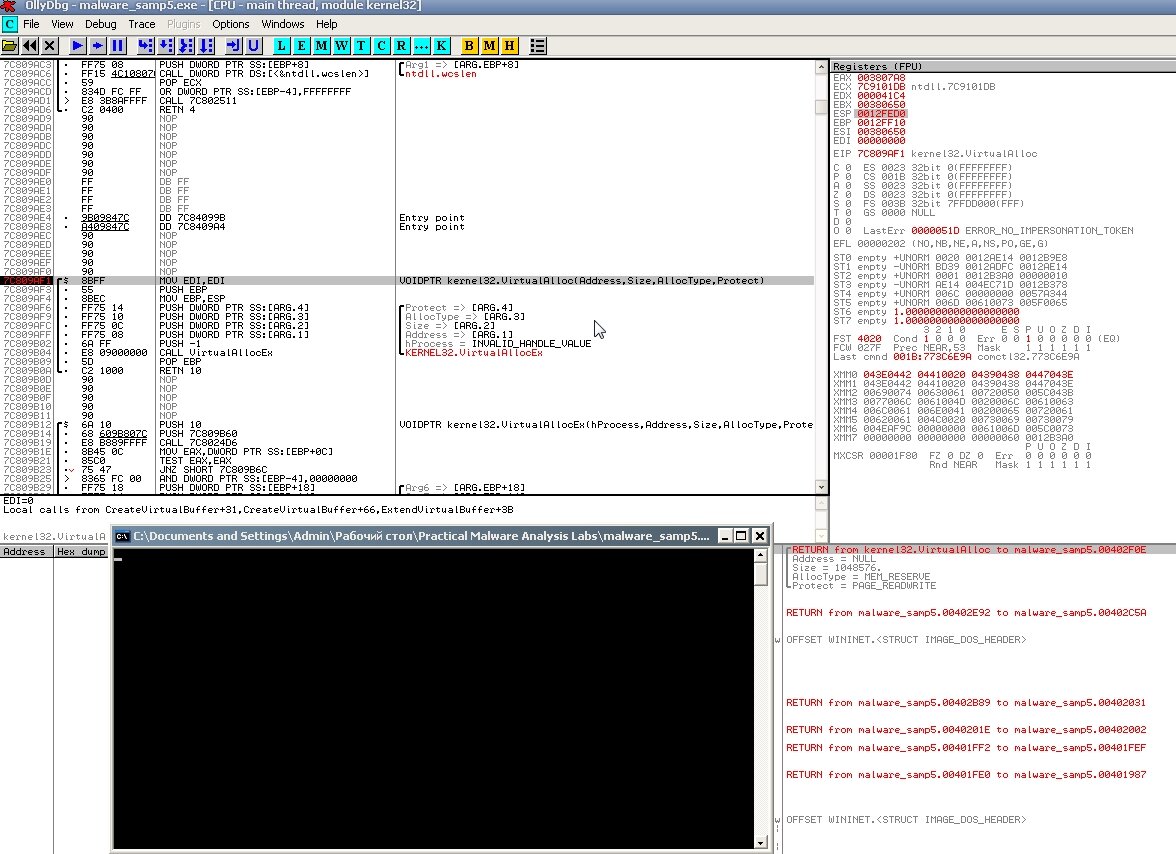
Load the file in OllyDbg, press Ctrl+G to open the Go To dialog, type VirtualAlloc, click OK to jump to the line you need, and set a breakpoint there with F2.
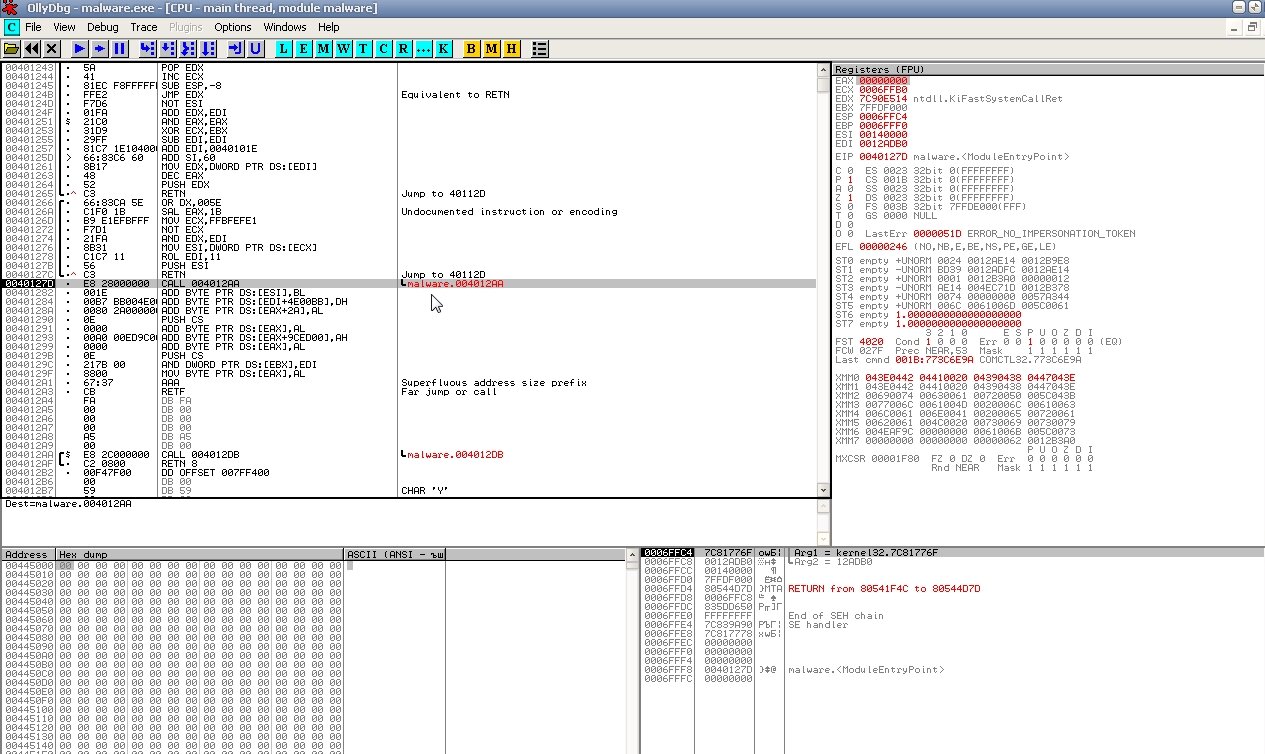
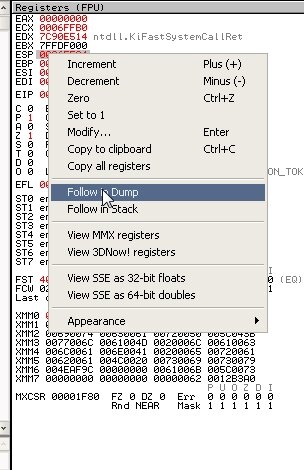
Now press F9 to run the program until it hits the breakpoint. In the right-hand register window, right-click the EAX value and select “Follow in Dump.”
Next, in the lower pane, select a few bytes and right-click Breakpoint → Hardware, write → Byte, then run the program again by pressing F9.
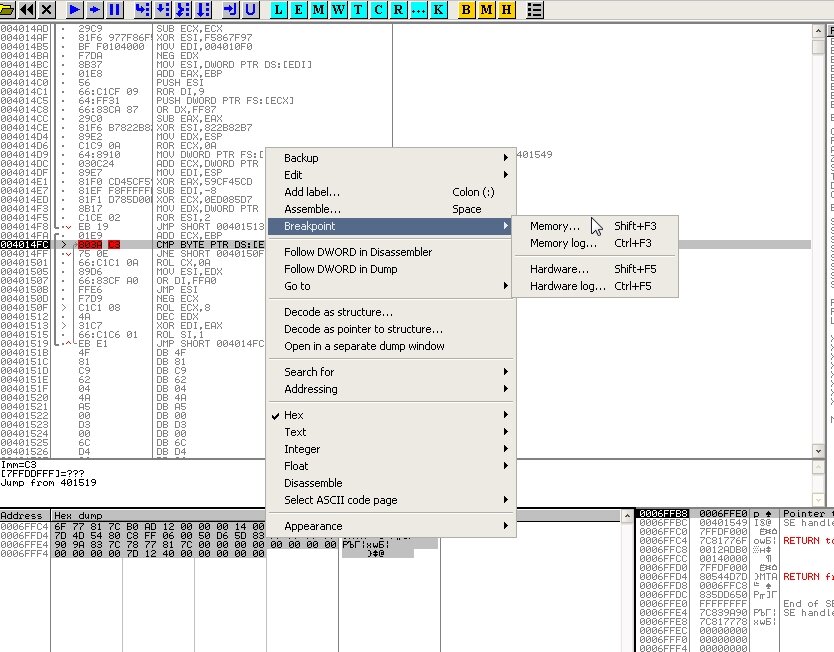
Repeat this until we hit the breakpoint again. What do we see? Could this be the PE section we’re after?
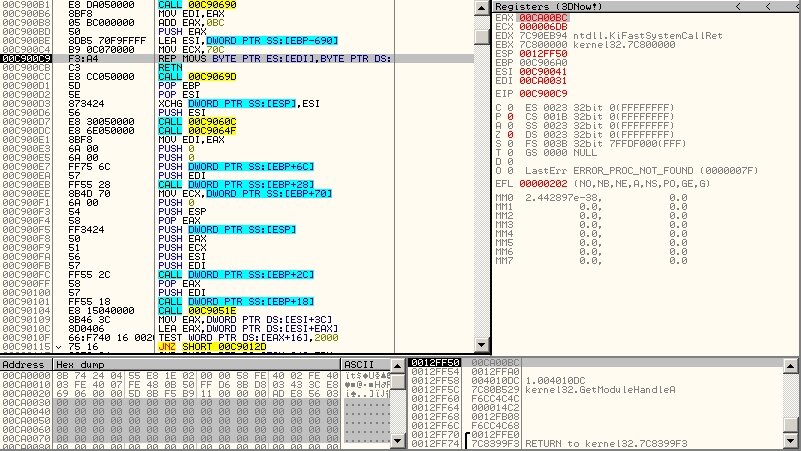
Not yet, because the sample is packed in multiple layers, so it has several packer entry points. Keep hitting F9 a few more times. To reach the real OEP, keep setting new breakpoints and use Follow in Dump from the registers pane. Eventually you’ll land on a POPAD instruction and see the original code.
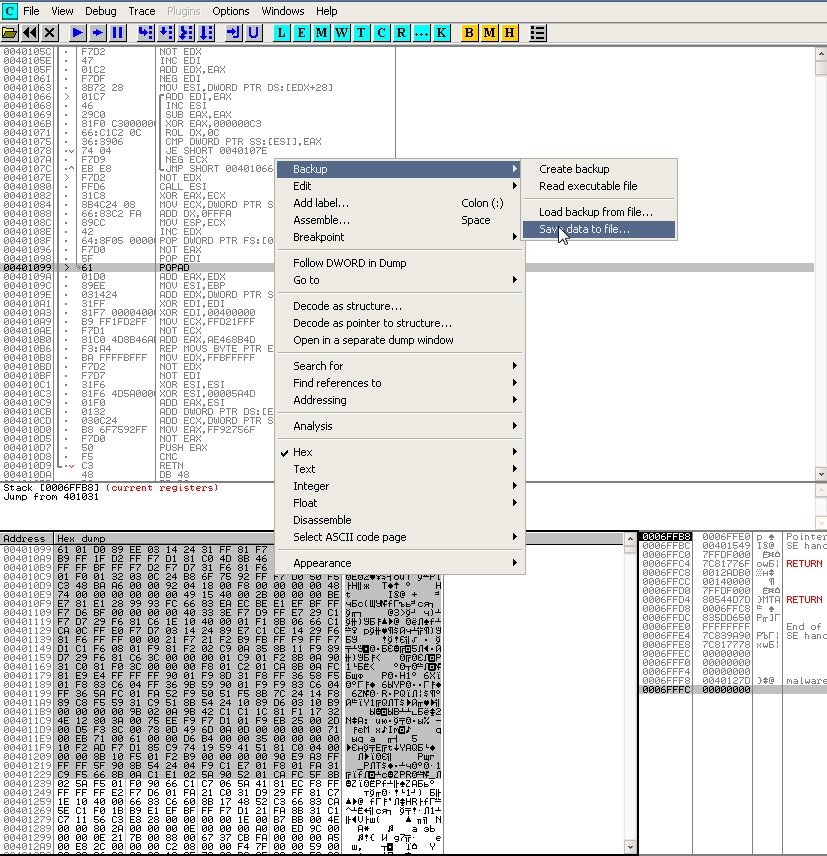
Now all that’s left is to dump the memory image to a file on the hard drive: select a few bytes in the lower pane and right-click BackUp → Save data to file.
Conclusion
Today we made solid progress: we refreshed the core theory of the PE file format and got hands-on with techniques for analyzing and unpacking different packers. Keep practicing, read the additional materials in the suggested links, analyze samples on your own—and success will follow!
I’m happy to answer any questions—reach out by email or leave a comment. Good luck with your research, and see you next time!
