Too Many Cooks Spoil the Broth
When a company starts taking information security seriously, it inevitably has to deploy a wide range of disparate systems. Antivirus, firewalls, network intrusion detection systems (NIDS), host intrusion detection systems (HIDS), web application firewalls (WAF), vulnerability scanners, integrity monitoring solutions — and that’s still far from an exhaustive list of what an organization might use. Since security is not just a state of a system (in the classical sense) but also a set of processes in which security event monitoring is integral, sooner or later there will be a need for centralized monitoring and analysis of logs, which these systems can generate in massive volumes.
And if you try to analyze all these logs together, you’ll run into a few problems. The first is that almost every log source uses its own format. On top of that, some systems can write logs in multiple different formats, each with a different level of detail.
For me, the gold standard for a well-designed logging subsystem is the Cisco ASA firewall. On the one hand, its logs are plain text and can be sent over syslog with ease. On the other, every line includes a unique event type identifier. Using that ID, you can quickly find a detailed description in the documentation (http://bit.ly/2nISj1X), including which parts of the message can vary and what values they may take. In this example, you’ll see events with IDs 302016 (Teardown ), 308001 (Console ), and 111009 (User ).
%ASA-6-302016: Teardown UDP connection 806353 for outside:172.18.123.243/24057 to identity:172.18.124.136/161 duration 0:02:01 bytes 313
%ASA-6-308001: console enable password incorrect for number tries (from 10.1.1.15)
%ASA-7-111009: User 'enable_15' executed cmd: show logging mess 106
Open-source intrusion detection systems are almost the exact opposite. Snort NIDS has four different log formats. One of them, unified2, is binary and requires the external utility barnyard2 to process. The upside is that, unlike the others, this format can include decoded application-layer protocol headers. The other three formats are text-based: two are multi-line and one is single-line. As you’d expect, their level of detail varies—from just the signature description and socket addresses to decoded transport-layer protocol headers. For example, the alert_full format looks like this:
[**] [129:15:1] Reset outside window [**]
[Classification: Potentially Bad Traffic] [Priority: 2]
03/11-13:34:05.716632 74.125.232.231:443 -> 98.14.15.16:2079
TCP TTL:60 TOS:0x0 ID:25102 IpLen:20 DgmLen:40
*****R** Seq: 0xFF405C9D  Ack: 0x0  Win: 0x0  TcpLen: 20
As for the alert_fast format:
[119:31:1] (http_inspect) UNKNOWN METHOD [Classification: Unknown Traffic] [Priority: 3] {TCP} 79.164.145.163:57678 -> 52.73.58.27:80
OSSEC HIDS has fewer log formats—just two: single-line and multi-line. It does, however, support several delivery methods: writing to a file, sending via the syslog protocol, or sending to a ZeroMQ server. The log format and contents largely depend on how OSSEC is configured and which modules are enabled. All OSSEC messages share the same header, but if the syscheck integrity monitoring module is used, then after the header—depending on the module’s settings—you’ll see checksums of the modified file and a diff of its changes. If that same alert is sent over syslog, the diff won’t be included. If the message is generated by the log analysis module, it will include the original log entry that triggered the alert. And there are many other such variations.
** Alert 1490901103.1401: - pam,syslog,authentication_success,
2017 Mar 30 23:11:43 hw1->/var/log/secure
Rule: 5501 (level 3) -> 'Login session opened.'
Mar 30 23:11:42 hw1 sshd[1427]: pam_unix(sshd:session): session opened for user root by (uid=0)
** Alert 1490901561.1803: mail - ossec,syscheck,
2017 Mar 30 23:19:21 hw1->syscheck
Rule: 550 (level 7) -> 'Integrity checksum changed.'
Integrity checksum changed for: '/etc/resolv.conf'
Size changed from '87' to '97'
Old md5sum was: 'd3465a94521bbadf60e36cdf04f04bea'
New md5sum is : '524d80c6cc4c76bd74a173ef4f40096a'
Old sha1sum was: 'b6e622f922f75200a32c3426f09ab92b8ab82b12'
New sha1sum is : '6a3e34e2f77af6687dc1583bee9118b620aa7af8'
With so many formats and storage methods, analyzing logs from all these systems can become quite labor-intensive. Of course, there’s a dedicated class of software to simplify this—SIEM. And while there are plenty of good open-source intrusion detection systems, open-source SIEMs are almost nonexistent. There are quite a few solutions tied to a specific IDS—for example, Snorby for Snort or Analogi for OSSEC—but they don’t let you add additional event sources. Some systems offer broader capabilities, but they’re basically free editions of commercial products with a host of artificial limitations. I’ve even seen one where the developers deliberately rewrote the database queries to make them slower. And even those systems weren’t particularly user-friendly. In the end, it’s a classic case of too many cooks spoiling the broth.
The Dream Team We’ve Been Waiting For
So the community needs an open‑source SIEM with no artificial limitations—fast, secure, and user‑friendly. After all, the number of security threats is growing by the day. And if you work at a 50‑person company, those threats hit you too, while the security budget is probably close to zero. You can deploy free IDS just fine, but you won’t have a proper way to analyze their logs. After a long search—and even attempts to write a SIEM in PHP—I found an approach that requires no coding and still delivers solid results when searching logs and handling alerts. The solution is to use the tightly integrated ELK stack: Elasticsearch, Logstash, and Kibana. The Search Guard or Shield plugins are a nice complement to this. To tie together all the pieces—packages, configs, plugins, and helper scripts—I wrote an Ansible playbook and published it on GitHub as LightSIEM.
Elastic Search
Elasticsearch is the centerpiece of this stack. It’s a document indexing and search engine built on the Apache Lucene library. The developers pitch it as a way to build your own enterprise Google. It’s often used as a datastore for heterogeneous information with search on top. Elasticsearch can index incoming message streams in real time and make them searchable. Another notable feature is out-of-the-box scalability: just bring up several servers on the same network, and they’ll discover each other and automatically distribute index storage among themselves. Naturally, all nodes participate in processing search queries. All operations, including CRUD, are performed via a REST API.
The Universal Converter
All requests and responses use JSON, so to ship logs to Elasticsearch we’ll need Logstash. Its primary job is to transform logs from one format to another. In our case, we’ll parse plain files or syslog messages into JSON documents and send them straight to Elasticsearch for indexing. Logstash is highly configurable thanks to a large ecosystem of plugins. One of the most useful is grok. Its main task is to check whether an incoming line (or lines) matches any of the defined patterns. Grok patterns are regular expressions on steroids: they let you build fairly complex expressions from simple building blocks and split incoming messages into multiple fields, each with its own name and meaning. The resulting JSON document looks roughly like this:
{
    "@timestamp" => 2017-03-30T19:25:54.264Z,
      "@version" => "1",
        "Classification" => {
            "Ident" => "106023",
             "Text" => "%ASA-4-106023"
        },
        "CreateTime" => 2017-03-30T20:37:22.000Z,
        "Level" => {
            "Origin" => "4",
            "Normalized" => 5
        },
        "Protocol" => "udp",
        "Name" => "cisco"
        "Source" => {
            "Node" => {
                "Geoip" => {
                    "ip" => "188.123.231.104",
                    "city_name" => "Moscow",
                    "country_code2" => "RU",
                    "location" => [
                        [0] 37.615,
                        [1] 55.752
                    ],
            },
            "Address" => "188.123.231.104",
               "Port" => "23256",
               "Name" => "188.123.231.104"
        },
    },
}
As I mentioned earlier, some IDSs log far more detail than they can send via the syslog protocol. In those cases, it’s best to read events directly from the multiline log files they write. For a long time, the only way to process such files was to install Logstash on the same server as the IDS. Many weren’t happy with that approach, since Logstash can put noticeable load on the CPU and consume a fair bit of memory when handling large volumes. Logstash is also written in JRuby and therefore requires Java on the server, which isn’t always desirable.
To address this, a separate utility called Lumberjack was created. It was later renamed Logstash Forwarder, and eventually the project was completely rewritten as Filebeat. The Beats family has since grown to include other tools as well: Packetbeat for network traffic, Winlogbeat for native Windows Event Log shipping, and more. I’ve already noted how fast ELK-related projects evolve—the journey from Lumberjack to Beats is a prime example.
Beats have a single job: read data from a source (for example, a log file) and ship it to a Logstash server. They’re lightweight, easy to configure, written in Go, and therefore don’t require Java. On top of that, the Beats authors are part of the ELK development team, which minimizes protocol compatibility issues and the risk of data loss.
Kibana in Full Bloom
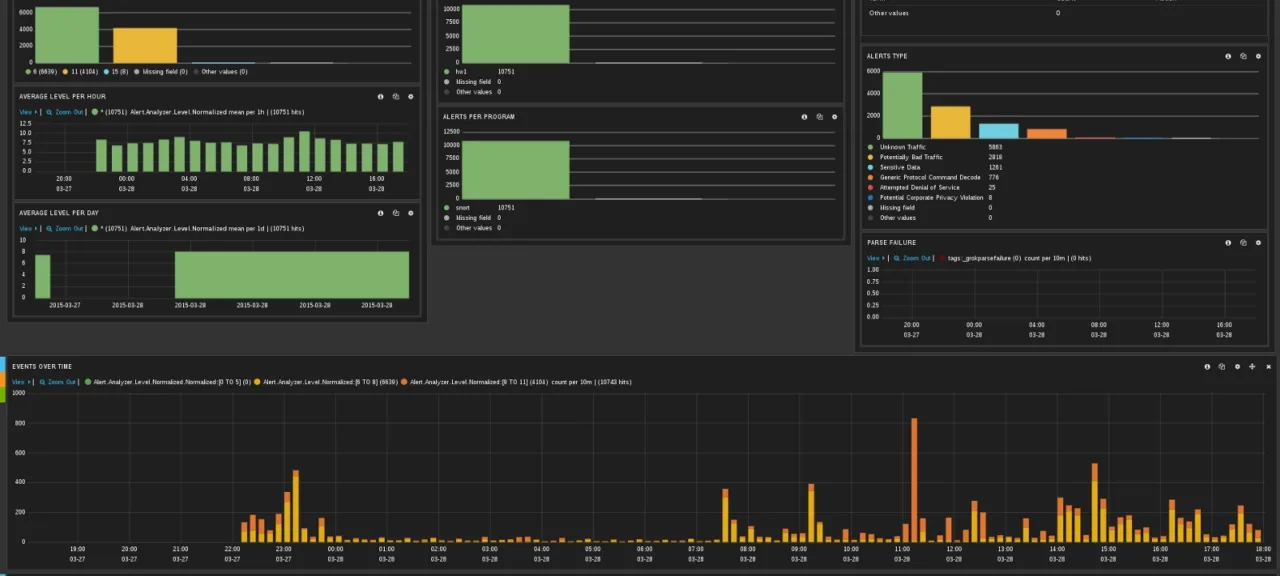
Of all the components, Kibana is the most user-friendly. It’s a web UI that lets you craft queries to Elasticsearch, build charts and histograms, and generally visualize your search results. You can, of course, inspect the matched documents with all the fields extracted by Logstash. All charts and visualizations in Kibana are fully interactive: select a time window on a histogram and it’s automatically added as a filter, and the entire dashboard updates accordingly. Likewise, click a bar that represents an alert severity level and it’s added to the query filter, so every visualization and the search results will show only events with that severity.

League for Safe ~Internet~ Search
If you have a problem and decide to solve it with Elasticsearch, congratulations—you’ve just created two more.
First: traffic encryption. Elasticsearch doesn’t provide any encryption by default, neither for client-to-server requests nor for server-to-server communication.
Second: there’s no familiar database-style access control. Those GRANT SELECT ON db2.alerts–type permissions simply aren’t there by default. In Elasticsearch, anyone who can reach the port can run any request—read, modify, delete. Many settings live in internal indices and can be changed on the fly via the same REST APIs.
In short, any attacker armed with a Telnet client can trample the confidentiality, integrity, and availability of your Elasticsearch cluster. Meanwhile, you’re storing telemetry about that very attacker in it. Not great.
These tasks were meant to be addressed with Elasticsearch plugins. They didn’t appear immediately, and not all of them have survived. Many were discontinued once Elasticsearch’s own security plugin—Shield—came out. Even though it required a paid license, many evidently found it simpler than developing their own security plugin. Other plugins just couldn’t keep up with Elasticsearch’s rapid evolution, as each new release changed parts of the API. As of now there are two main plugins that provide encryption and access control. Shield, as mentioned above, is Elastic’s commercial product. The other—Search Guard—is a third‑party project by the German company floragunn. Its source code is available on GitHub.com, and the developers offer commercial support. Search Guard consists of two plugins: Search Guard SSL and Search Guard. Search Guard SSL provides encryption for traffic between nodes and clients. Search Guard is an optional add‑on to Search Guard SSL that implements authentication and authorization. Permissions can be restricted at the index level and by data type (the _type field that every Elasticsearch document must have). For example, you can grant access to intrusion detection logs only to security officers, while allowing network equipment logs to be viewed by both security and network administrators.
Rule them all
Right after I first tried to wire all the components together, it was clear that recreating the whole setup from scratch a couple of months later would be painful. The usual culprits were to blame: information overload and a lousy memory. Tracking down certain settings took a noticeable amount of time, and I didn’t want to burn that time again fixing the same issues. But that was only half the problem. If you want others to use your solution, it has to be accessible. For open-source software, the key to accessibility is ease of installation—and in my case, that was lacking.
The obvious option was to write a long guide showing how to install and configure everything. The catch was that the ELK stack was still pretty new and few people knew it well. On top of that, I was making changes almost every day. Any article would either be outdated by the time it was finished or never get finished at all.
So I figured it would be better to write a script instead of documentation—something anyone could understand that would also install and integrate all the components. That “script” ended up being Ansible. It let me write playbooks that are fairly human-readable, and when executed they carry out the tedious, complex sequence of steps to install and configure everything. Plus, Ansible is agentless: it doesn’t require anything on the target servers beyond SSH access.
- name: Check search-guard-5 is installed
   command: /usr/share/elasticsearch/bin/elasticsearch-plugin list | grep search-guard-5
  register: sg_installed
- name: Install search-guard-5
  command: /usr/share/elasticsearch/bin/elasticsearch-plugin install -b com.floragunn:search-guard-5:5.1.1-9
  tags: configuration security
  when: sg_installed.stdout != "search-guard-5"
Unify them all
Beyond automation, we also had to tackle data correlation across disparate sources. First, each event source has its own alert severity scale. In general, that level is meant to indicate how likely an intrusion has occurred or is in progress. In Snort, the highest likelihood is level 1 and the lowest is level 4. In OSSEC HIDS, the highest likelihood maps to alert level 15, while level 0 is for events that don’t warrant any attention at all.
Second, different systems emit different data sets. For example, Snort alerts always include the source and destination addresses of the potential attack. In OSSEC alerts, by contrast, those fields may be missing entirely or only implied.
To make these heterogeneous data points at least somewhat comparable, we had to define a field schema and normalize all incoming messages to it. I based it on the standard IDMEF — Intrusion Detection Message Exchange Format. It already defines a data structure that covered about 90% of our needs.
Because everyone uses different date and time formats, we had to normalize those as well. Currently, all extracted timestamps are stored in the Alert.CreateTime field. In addition, the service field @timestamp records when the event was saved to Elasticsearch. We need both fields because with guaranteed-delivery transports like Beats or TCP, network issues can cause senders to buffer events and deliver them later. Consequently, it’s incorrect to process events based on @timestamp.
Deploying LightSIEM
As of now, LightSIEM can ingest virtually any logs over syslog or Beats. However, not every log source has Logstash patterns defined. The most complete support is available for OSSEC and Snort. Their logs can be sent via syslog, or written to a file in the standard multiline format and then shipped with Filebeat. The first approach is convenient because you only need to enable syslog forwarding to the target server—events will immediately show up in the SIEM. As mentioned earlier, the second approach provides richer context but takes a bit more effort, since you need to install and configure an additional package. Logs from Cisco network devices—routers and firewalls—are also supported. Auditd logs are partially supported.
Even though I’ve tried to make installing LightSIEM as straightforward as possible, let’s walk through the process in detail—what happens when the playbook runs and how incoming logs are handled. Before you start installing LightSIEM, it’s a good idea to have the data sources you plan to analyze.
First, you’ll need a dedicated Linux server. CentOS/RHEL/Oracle Linux 7.0 or later is ideal. The playbook is optimized for these distributions, but if you prefer another, you can review what the playbook does and adapt it to your favorite distro—and commit your changes to our GitHub ;).
Once the server is prepared and has internet access, install Ansible and unzip. The easiest way to install Ansible is from the EPEL repository. So, to begin, run two commands:
yum install epel-release
yum install ansible unzip
Next, download the code archive and extract it using the following commands:
wget https://github.com/dsvetlov/lightsiem/archive/v0.2.1.zip
unzip master.zip
Everything’s now ready to run the playbook and install everything needed for LightSIEM:
ansible-playbook lightsiem-master/lightsiem-install.yml
Here’s a quick overview of what the script does. First, it adds the official Elasticsearch repositories. Then it installs the core components: Logstash, Elasticsearch, and Kibana. Next, it deploys the Logstash configuration files. They’re split into several separate files to make them easier to navigate—we’ll go over what each one does a bit later. The script also installs additional Grok patterns: separate files that define regular expressions used to parse incoming messages. It opens the necessary ports in firewalld. If you’ve replaced firewalld with iptables on your system, no worries—the script will ignore those errors, but you’ll need to open the ports yourself. After all that, the script installs Search Guard and imports several dashboards into Kibana.
So, you’ve got LightSIEM installed and the ports opened. Now you need to pipe alerts from OSSEC into it. The easiest way is to add the following lines to the main section of the server config:
<syslog_output>
   <server>address of LightSIEM server</server>
   <port>9000</port>
   <format>default</format>
</syslog_output>
Naturally, inside the
At this point, a configuration file called common kicks in. As the name suggests, it’s involved in processing all logs. Its primary role is to enrich our events with additional context.
Extracting Events from Logs
All incoming messages, regardless of source or protocol, are processed in Logstash. Setting up Logstash turned out to be the most time‑consuming and challenging part, but also the most valuable for event analysis. The first step for every incoming event is parsing with the grok filter. At this stage, a long event line is broken down into a set of shorter fields. All fields are named according to a common schema so that semantically similar data land in the same field even if they come from different sources.
For example, Snort might log a port‑scanning attempt from a specific IP address. OSSEC might raise an alert that someone logged into a server from a particular address. And a firewall will log all connections passing through it, including their source addresses. In all three cases, the source address is written to the Alert.Source.Node.Address field. This means that when high‑priority events are detected, you can find all events from that IP address with just a couple of clicks.
After the incoming messages are split into many small fields, a few more transformations are applied. The first is to normalize alert levels to a single scale. I based this on the OSSEC scale because it’s well documented and offers 16 levels, unlike Snort, which only has four.
if [type] in ["snort", "snort_full", "snort_barnyard"] {
        if [Alert][Analyzer][Level][Origin] == "1" {
              mutate { add_field => [ "[Alert][Analyzer][Level][Normalized]", "15" ] }
        } else if "[Alert][Analyzer][Level][Origin]" == "2" {
              mutate { add_field => [ "[Alert][Analyzer][Level][Normalized]", "11" ] }
        } else if "[Alert][Analyzer][Level][Origin]" == "3" {
              mutate { add_field => [ "[Alert][Analyzer][Level][Normalized]", "6" ] }
        } else if "[Alert][Analyzer][Level][Origin]" == "4" {
              mutate { add_field => [ "[Alert][Analyzer][Level][Normalized]", "4" ] }
        }
}
After that, you need to extract the timestamps from whatever fields they ended up in and convert/normalize them. The variety of ways timestamps were recorded was sometimes surprising, too.
Next comes event enrichment. The first thing that greatly simplifies event analysis is reverse DNS lookups. It’s much easier to work with server hostnames than with bare IP octets. That way, at a glance you can tell whether a given machine is from a provider’s dial-up pool in Tver or a server from the vk.com farm. For every source and destination IP address present in an event, Logstash tries to resolve it to a DNS name. If successful, the event will include Alert. and Alert. alongside Alert. and Alert..
Naturally, not all addresses resolve to hostnames, yet searches are usually done by the name field. To avoid a situation where some events have a DNS name while others don’t, Logstash writes the IP address into the DNS name field when resolution fails. This way, you can treat the Alert. fields as universal—there will always be either an IP address or a DNS name present.
Because you need fast lookups even under heavy event load, LightSIEM includes the dnsmasq DNS server. To avoid expanding the server’s attack surface and opening yet another external port, Ansible installs and configures dnsmasq to listen only on the loopback interface. Since each host has its own upstream DNS settings, dnsmasq is set to use the servers listed in /etc/resolv.conf as a broadly compatible default. To reduce load on upstream resolvers and speed up responses, dnsmasq is configured to cache answers. As a result, if Logstash issues multiple queries for the same name, it will be resolved only the first time; all subsequent replies will be served from the cache.
if ![Alert][Source][Node][Name] and [Alert][Source][Node][Address]
{
    mutate { add_field => [ "[Alert][Source][Node][Name]", "%{[Alert][Source][Node][Address]}" ] }
    dns {
        reverse => [ "[Alert][Source][Node][Name]"]
        action => "replace"
        nameserver => "127.0.0.1"
    }
}
In addition to reverse DNS lookups, we query a GeoIP database. This lets us enrich events with approximate coordinates for IP addresses and later plot them on a map in Kibana. Keep in mind these coordinates are estimates and often reflect the address of the organization that owns the IP. Still, it’s one of the most striking ways to visualize intrusion data—no Hollywood action movie is complete without a map like this.
geoip {
source => "[Alert][Source][Node][Address]"
     target => "[Alert][Source][Node][Geoip]"
}
"Geoip" =>
        {
            "ip" => "188.123.231.104",
            "city_name" => "Moscow",
            "country_code2" => "RU",
            "location" => [
                [0] 37.615,
                [1] 55.752
            ],
        }
Another key role Logstash plays is integrating with other systems. The simplest option is email: you can open an incident in most incident management platforms from an incoming message, and email is also the quickest way to notify all stakeholders about an incident. Logstash is quite flexible here. For example, you can query Elasticsearch and use the results to decide how to handle an incoming event—useful for building correlation rules down the line. You can also run arbitrary commands or scripts, which is essentially a universal integration mechanism. Need to send an SMS? Call a script. Need to write a record to an external database? Same—run an external script. You can even add a bit of IPS-like functionality: if Snort logs attack attempts from a specific address, a script can block that address on the firewall. At the same time, you can define very granular filters—set any conditions on event fields, such as requiring a specific source IP, a particular code, and a severity of at least 15.
Logstash sends all events to Elasticsearch for storage and indexing. Elasticsearch’s primary role is to store incoming data and prepare it for fast search. Data is organized into indices. Each index must have at least one shard, which is a partition of the index. Indices can also have replicas—copies of shards placed on other nodes to improve fault tolerance and help serve search requests.
If a single Elasticsearch server can’t handle the ingest or query load, you can easily add more servers. A key advantage of Elasticsearch is how little effort it takes to form a multi-node cluster and balance the load. When nodes are on the same network, they can automatically discover each other, after which shards and replicas are distributed across the cluster. This makes it straightforward to build large clusters that are both reliable—thanks to replicas being spread across different nodes—and horizontally scalable.
Elasticsearch can automatically infer field types, and its schema can grow dynamically as new records arrive. This means that if you add a new field on the Logstash side, you don’t need to change anything in Elasticsearch. Documents will be stored with all the fields they contain, and if a field hasn’t been seen before, Elasticsearch will create it automatically.
Another feature that can be useful in some cases is field analyzers. By default, all document fields are analyzed—similar to how search engines work: sentences are tokenized, words are lowercased, and so on. In a SIEM system, where most fields are fixed event descriptors, numeric codes, and IP addresses, this is unnecessary and only slows the system down.
While dynamically created fields and automatic type inference are very handy—especially during development—they can sometimes cause trouble. For example, if a field that should hold a numeric alarm level is accidentally inferred as text, many of Kibana’s charting features will become unavailable. To control field types, names, and many other settings, you use index templates. In general, a template is created as a document in Elasticsearch and stored there; its settings include which indices it applies to.
In LightSIEM, Logstash creates a new index every day. This prevents indices from growing without bound and makes it easy to delete data for a specific day. The mentioned index template is provided as an option when sending data to Elasticsearch. Logstash checks whether that template already exists in Elasticsearch and creates it if it doesn’t. The template, in turn, defines each field’s properties—its type and whether it should be analyzed.
Users interact with the SIEM through Kibana’s web interface, which is built for Elasticsearch. It lets you create interactive dashboards with charts. Every element in a chart is clickable: when you click it, the selected value is added to the dashboard’s query filter, and all visualizations refresh accordingly. For example, you can place on a dashboard a list of hosts that generated events, a list of hosts that received events, and alert severity levels. Clicking a specific server in the list of attack sources will update the other charts so you can see which servers targeted that server and what their alert severities are. If you then click a particular alert severity, it’s added to the filter as well, letting you see which servers launched attacks of that severity against your server.
Kibana can use GeoIP data added by Logstash to plot attack sources or victims on a map. Time-based histograms are also very useful: you can select a time range with the mouse, and it’s automatically applied as a filter across the entire dashboard. This makes it easy to focus on events from a specific time window. Naturally, each event can be viewed in both a brief summary and a detailed view.
Conclusions
So. You’ve installed LightSIEM by now (you have, right?), and I hope I’ve explained in enough detail how it works. You can absolutely use it as a base and tailor it to your needs. You can also run it as-is and just add rules. If you decide to commit changes to the repository, remember that you’ve made the world a little bit safer. If you’re not sure how to implement your ideas, feel free to reach out — we’ll think it through together and implement what we can.