Built-in interpreter
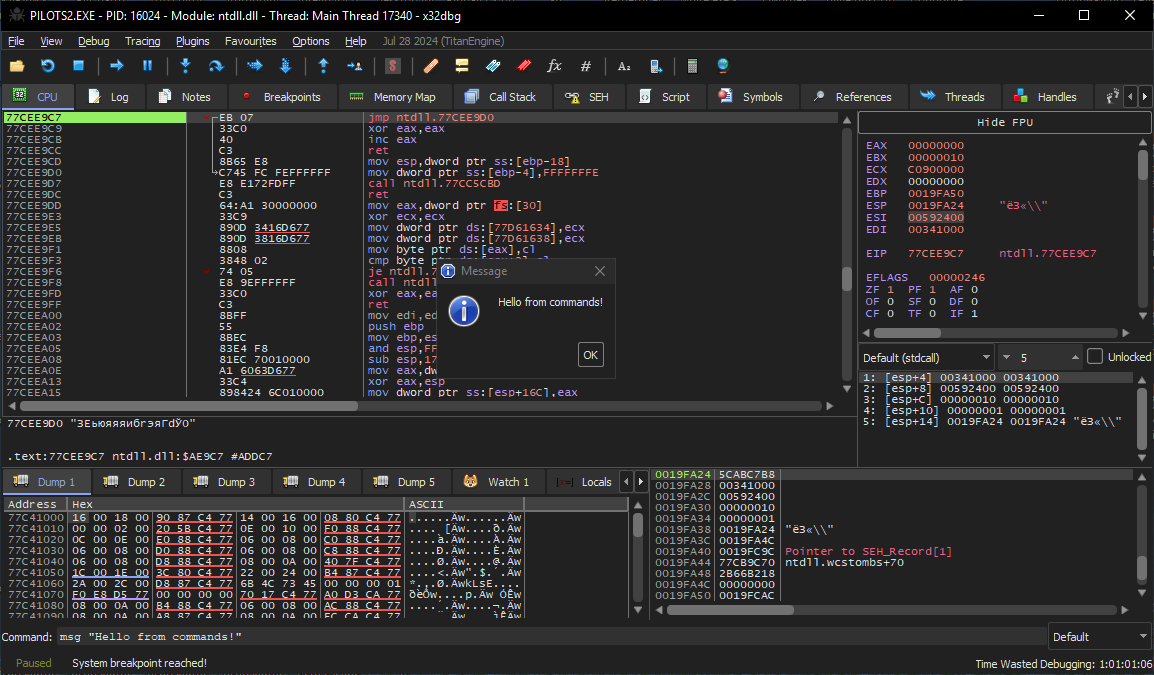
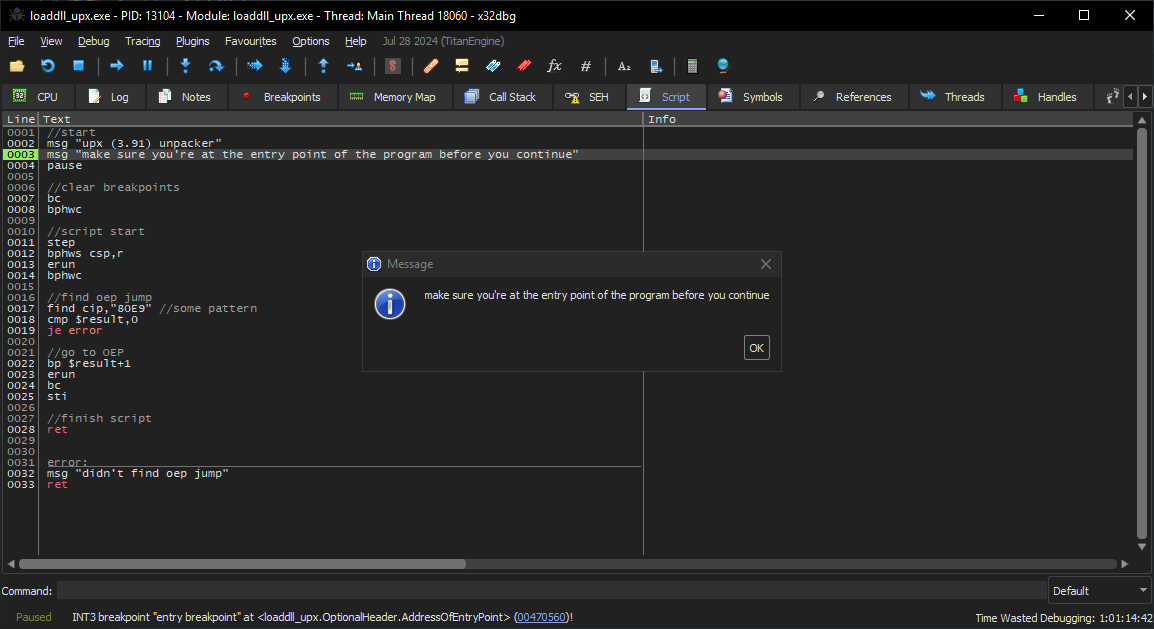
The debugger has a simple built-in scripting language that can be used to solve some everyday tasks. Let’s examine a script written in this language that unpacks UPX-packed files.
//start
msg "upx (3.91) unpacker"
msg "make sure you're at the entry point of the program before you continue"
pause
//clear breakpoints
bc
bphwc
//script start
step
bphws csp,r
erun
bphwc
//find oep jump
find cip,"80E9" //some pattern
cmp $result,0
je error
//go to OEP
bp $result+1
erun
bc
sti
//finish script
ret
error:
msg "didn't find oep jump"
ret
The syntax speaks for itself: a command name is followed by a comma-separated set of arguments; comments are marked by two slashes; strings are enclosed in double quotes; and numeric constants are interpreted as hexadecimal numbers (i.e. 100 actually means 256).
The same command can have several names: long and short forms. For example, the SetBPX command that sets a breakpoint can be written as bp. The short notation is convenient when you are managing the debugger from the built-in console located at the bottom.

A work-ready script can be loaded from a text file and then executed or debugged in single-step mode (you press Tab to move to the next string).

To find out what this script actually does, let’s rewrite its commands in a long form:
pause
//clear breakpoints
DeleteBPX
DeleteHardwareBreakpoint
//script start
StepOver
SetHardwareBreakpoint csp,r
erun
DeleteHardwareBreakpoint
//find oep jump
find cip,"80E9" //some pattern
cmp $result,0
je error
//go to OEP
SetBPX $result+1
erun
DeleteBPX
StepInto
//finish script
ret
error:
msg "didn't find oep jump"
ret
The first command, pause, pauses the script execution, after which it should be resumed manually; execution will continue starting from the next command. This is useful when the user has to perform an action (e.g. set an EIP at the entry point).
Next, DeleteBPX deletes all software breakpoints; while DeleteHardwareBreakpoint clears the processor debug registers. The StepOver string tells the debugger to take one step in single-step mode (i.e. move to the next assembly instruction in the code without entering CALL; instead, the debugger jumps directly to the subsequent command).
SetHardwareBreakpoint expectedly sets a hardware breakpoint. It has one mandatory and two optional arguments: address where the breakpoint is set, breakpoint type, and size of the ‘trigger’ area in bytes. The first argument is the CSP register; this is a special virtual register that will be read as ESP on x32 and as RSP on x64. The second argument, r, denotes the readwrite type (i.e. a debug interrupt will be triggered when a byte at the specified address is written or read).
The erun string releases the execution flow until a breakpoint is triggered. After that, all hardware breakpoints are deleted using DeleteHardwareBreakpoint. At this point, the EIP register is set to the address of the first instruction that changes the byte on top of the stack. At the time of script execution, this will be the end of the unpacking process.
The find instruction searches for a pattern on a specified memory page. The first argument is the address from where the search begins. It’s taken from the CIP register (EIP in the test x32 file). The second argument is the 80E9 pattern, which is a regular substring. The command supports wildcards, so you can use question marks to specify unknown elements of the pattern (e.g. EB0?90??8D).
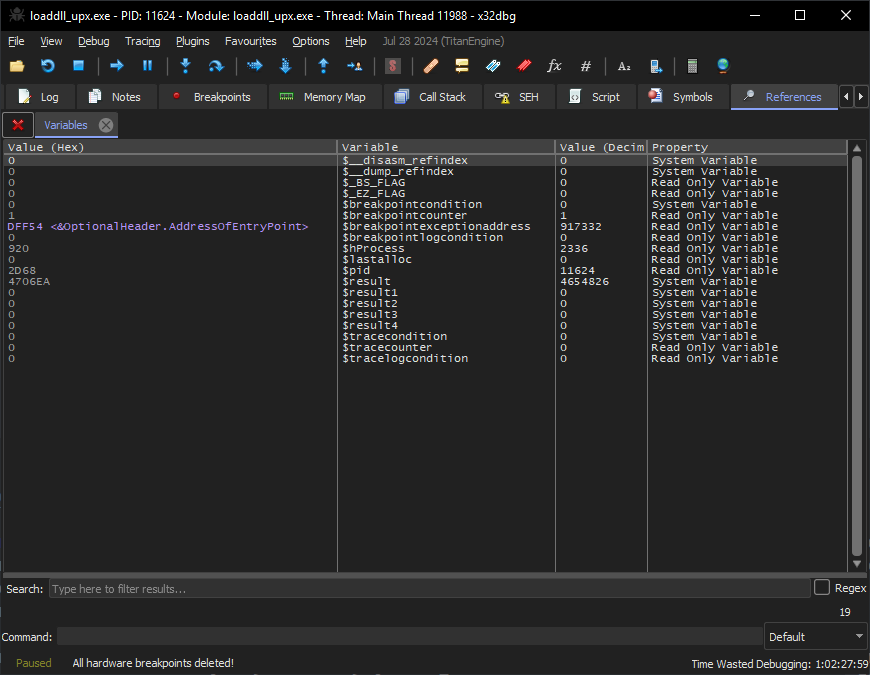
The result (i.e. found entry address) is stored in the $result global variable. The next command, cmp (short for compare), compares it with the 0 constant that will be returned to find if no entry point is found. The logic of cmp is the same as in the x86 version: the comparison result is written to the global variables $_EZ_FLAG and $_BS_FLAG that are similar to flags in the EFLAGS processor register.

Inside the script, control is transferred using the je command (short for Jump if Equal). In this particular case, if the 80E9 substring isn’t found, the script would transfer control to the error label.
Then SetBPX sets a software breakpoint at $result+1. Scripts support expressions with multiple operations on variables. 1 is added to the found address; this is the address of the JMP command that transfers control to the original entry point immediately after unpacking the file. The familiar erun and DeleteBPX come next.
The last significant command is StepInto; it asks to take one step in single-step mode (i.e. execute the found JMP instruction and transfer control to the first instruction of the unpacked file). After that, the script execution ends on the ret command.
Historical background
It must be noted that the concept of such scripts goes back to an old plugin for OllyDbg called OllyScript. The x64dbg debugger is its spiritual successor inheriting its best practices. In OllyScript, the script used to unpack UPX looks as follows:
var hwdBP
var softBP
sti
findop eip, #61#
mov hwdBP, $RESULT
bphws hwdBP, "x"
run
findop eip, #E9????????#
mov softBP, $RESULT
bp softBP
run
sti
cmt eip, "<<>>"
msg "OEP found, you can dump the file starting from this address"
ret
Spot the difference…
Plugins
Another way to automate debugging is writing plugins for x64dbg. A plugin is a regular DLL file compiled with included headers from the Plugin SDK. When a plugin is loaded, the debugger searches the DLL export for the pluginit and plugsetup functions that provide information about the plugin and register new commands.
When you download the latest release of the debugger, it includes the Plugin SDK: a set of header and binary files that inform the compiler which functions can be called from an external module.
All new functions are defined in headers. No ‘normal’ documentation is available for them, but all required information is contained in the text of the header files. For example, \:
namespace Script{ namespace Debug { SCRIPT_EXPORT void Wait(); SCRIPT_EXPORT void Run(); SCRIPT_EXPORT void Pause(); SCRIPT_EXPORT void Stop(); SCRIPT_EXPORT void StepIn(); SCRIPT_EXPORT void StepOver(); SCRIPT_EXPORT void StepOut(); SCRIPT_EXPORT bool SetBreakpoint(duint address); // (...) };};The function names are self-explanatory. Due to nested namespaces, a function call looks like Script::. This is because names can repeat in different contexts.
To save time, I simply downloaded a ready-to-build plugin. It can be built in Visual Studio — provided that the Windows SDK and the required compiler are installed on your system. All that remains is to replace a couple of functions, and the new plugin will be work-ready:
#include "pluginsdk/_scriptapi_debug.h"#include "pluginsdk/_scriptapi_memory.h"#include "pluginsdk/_scriptapi_register.h"#include "pluginsdk/_scriptapi_pattern.h"#include "pluginsdk/_scriptapi_comment.h"#include "pluginsdk/_scriptapi_gui.h"#include "pluginsdk/bridgemain.h"#define PLUGIN_NAME "unpack_upx"bool pluginInit(PLUG_INITSTRUCT* initStruct){ if(!_plugin_registercommand(pluginHandle, PLUGIN_NAME, cbCommand, false)) _plugin_logputs("[" PLUGIN_NAME "] Error registering the \"" PLUGIN_NAME "\" command!"); return true;}static bool cbCommand(int argc, char* argv[]){ Script::Debug::Wait(); auto cip = Script::Register::GetCIP(); if (Script::Memory::ReadByte(cip) == 0x60) { DbgCmdExecDirect("bc"); DbgCmdExecDirect("bphwc"); auto found = Script::Pattern::FindMem(cip, 0x1000, "83 EC ?? E9"); if (found) { Script::Debug::SetBreakpoint(found + 3); Script::Debug::Run(); Script::Debug::StepIn(); Script::Comment::Set(Script::Register::GetCIP(), "OEP"); Script::Gui::Message("Reached OEP. Use Scylla to dump and restore imports!"); DbgCmdExecDirect("scylla"); } else Script::Gui::Message("Couldn't find OEP jump (83 EC ?? E9)..."); } else Script::Gui::Message("Put EIP on a UPX entry point (0x60) to continue..."); return true;}Let’s find out what the code does. The _plugin_registercommand function in pluginInit registers a new command; it can be called by name directly from the console. The cbCommand callback is triggered in this case.
First, the code checks that the byte at the EIP address is equal to 0x60, which is a simple signature: the first opcode in UPX is pushad, and it’s represented in binary format as 0x60.
Then DbgCmdExecDirect is called: this is a direct execution of text commands (like a string for the interpreter). Using it, the familiar commands that clear the list of breakpoints are called. Then Script:: searches for the code address using the 83 pattern.
83EC 80        sub esp,FFFFFF80
E9 80F9F9FF    jmp loaddll_upx.OEP
This is what the desired assembler code looks like; the number of bytes subtracted from ESP is not known in advance; so, ?? is used instead of 80. This is the last instruction after unpacking followed by a jump to the original entry point.
When the required address is found, a breakpoint is set on it. When it’s triggered, the code takes one step forward. At this point, a comment is added to the current EIP, and then scylla is called: a tool embedded in x64dbg that dumps (i.e. restores) files unpacked in the process memory back into EXE.
Time to test the plugin. I compile the source code, change the output file name to unpack_upx., and place it in the x64dbg\ folder. Then I start the debugger and see the following information in the log:
[[[
Voila! The plugin has been loaded. I go to the entry point in the UPX-packed file, enter the unpack_upx command, and immediately see a message: unpacking successful; scylla started. It’s working!
Automation with Python
The x64dbgpy plugin first appeared as a third-party project, but now it’s maintained by mrexodia, one of the creators of x64dbg. As you may have guessed, the plugin adds support for Python scripts. To use it, you have to install Python 2.7.10 on your system. An external (i.e. not embedded into the plugin body) interpreter makes it possible to install third-party libraries using pip, which significantly expands the capabilities of your scripts. For example, in the course of debugging, you might need some exotic cryptography, or a parser for some rare format, or a different decompiler…
info
The Python support clearly distinguishes a promising large-scale project. Hopefully, some day it will be added to other tools as well.
After installing the plugin, you select Plugins → x64dbgpy → Open GUI Script in the menu and load a ready-made script from the disk. Individual commands can be executed in the console. To enable this feature, change Default to Python in the drop-down list to the right of the input line.
Below is an example of a script that implements UPX unpacking:
from x64dbgpy.pluginsdk import *import syscip = register.GetCIP()if memory.ReadByte(cip) != 0x60: gui.Message("Start at UPX entry point (1:[CIP]==0x60)") exit(0)x64dbg.DbgCmdExecDirect("bc")x64dbg.DbgCmdExecDirect("bphwc")found = pattern.FindMem(cip, 0x1000, "83 EC ?? E9");if found == 0: gui.Message("Could not find pattern!"); exit(0)debug.SetBreakpoint(found + 3)debug.Run()debug.StepIn()cip = register.GetCIP()comment.Set(cip, "OEP Found by Python!")gui.Message("Reached OEP. Use Scylla to dump and restore imports!")x64dbg.DbgCmdExec("scylla")Its similarity with the plugin code is evident. The reason is simple: functions called from Python are nothing more than wrappers over Plugin SDK API. Accordingly, the names of Python functions almost exactly repeat names from included headers for C++.
No ‘normal’ documentation is available for the plugin, but there is a good cheat sheet with examples.
External automation
So far, the debugger was managed from within: it executed loadable external scripts. This approach is suitable if you perform semi-automated analysis or unpack a specific file. But what if you have to analyze hundreds of files? In such situations you need an external tool that creates debugger instances and manages them from the outside. This is exactly what x64dbg-automate does.
The tool consists of two parts: a Python library acting as a server and a plugin for x64dbg acting as a client. To install it, copy the plugin to the debugger folder and install the plugin management library using pip:
pip install x64dbg_automate --upgradeUnlike the previous plugin, x64dbg-automate supports the modern Python3, which significantly expands the list of libraries available to you.
The API set has been created from scratch, but this is just a handy wrapper for the Plugin SDK. Names of API methods don’t match those in the Plugin SDK, but the full documentation is available for the tool.
Let’s examine the following script:
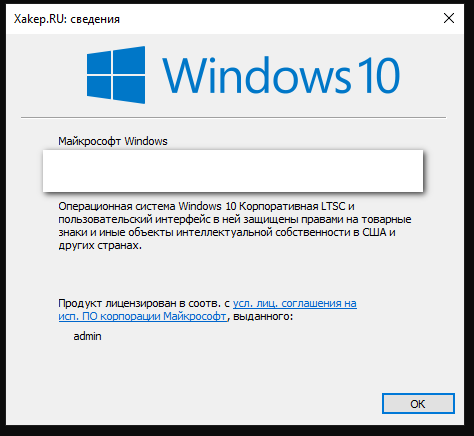
from x64dbg_automate import X64DbgClientclient = X64DbgClient(x64dbg_path=r"C:\Soft\x64dbg\x64\x64dbg.exe")client.start_session(r'c:\Windows\System32\winver.exe')mem = client.virt_alloc()client.write_memory(mem, 'Xakep.RU'.encode('utf-16le'))client.set_breakpoint('ShellAboutW', singleshoot=True)client.go() # Entrypoint breakpointclient.wait_until_stopped()client.go() # ShellAboutWclient.wait_until_stopped()client.set_reg('rdx', mem)client.go()client.detach_session()First of all, a debug session is created, including paths to the debugger and the debugged file. Next, the debugger starts. Then a memory block is allocated in the process memory, and a UTF-16 encoded string is written to it using internal APIs. You set a one-time breakpoint at the entry to ShellAboutW, wait until the debugger reaches it, and edit the RDX register. According to the calling convention in x64 code, the second argument for WinAPI is passed via RDX. Therefore, by substituting the string address in it, you can change the window title on the fly.

According to the plugin author (darbonzo), x64dbg-automate was created with emphasis on malware analysis. External scripts make it possible to analyze thousands of samples at a time. And debugger management via Plugin SDK makes it possible to automate unpacking, bypass anti-debugging, and even compare signatures in the memory of an unpacked sample using the YARA engine.
Conclusions
Automated debugging is suitable for almost all operations that are normally performed manually. And that’s a lot! In fact, you get a customizable tool that analyzes executable files and automates all operations with them. In subsequent articles, I will show how to automate other popular tools.
See you soon!
