
The Plaso file that you’ve got after reading the previous article, Timeline of everything. Collecting system events with Plaso, will be used as a data source in today’s investigation. As you remember, last time, you have extracted from the hard drive image of the attacked computer all events and objects having at least some time stamp and outlined a search schema that will be used to find events that are of interest to you.
It’s more productive and fun to solve serious problems collectively, and this fully applies to forensics. Therefore, ?homo forensicus? use teamwork tools, including Timesketch.
Timesketch is an open-source project for collaborative forensic timeline analysis. It’s based on a powerful query language called Elasticsearch (hereinafter ES). Provided that your configuration is correct, ES ensures that you project automatically gains is main features: scalability, fault tolerance, and high search speed (combined with enormous consumption of computer resources).
Installation
You can install either the release version or the development version. In the latter case, you will be able to edit the code and apply the most recent commits. On the other hand, if you stumble upon fresh bugs, blame yourself and don’t forget to report them.
I am going to install the release version on a VM running Ubuntu 20.04 and add the Kibana data visualization dashboard to the system.
info
When you deal with ES-based projects, best practice is to add Kibana. It allows to analyze processes that occur inside the database and detect abnormal situations.
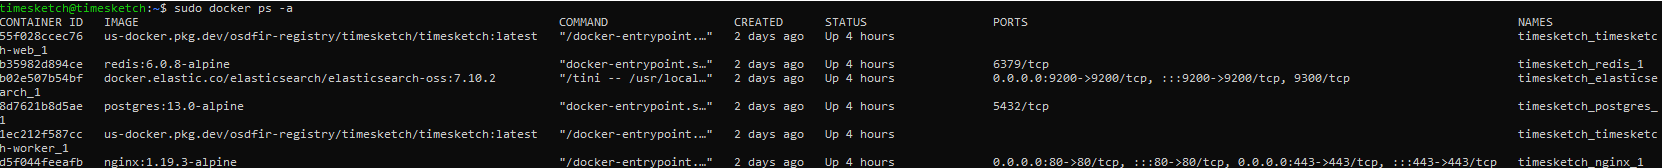
There is no point in retyping commands from the official instruction; so, I assume that your installation was successful. To check this, type:
$ sudo docker ps -aIf everything is OK, the output should be something like this.
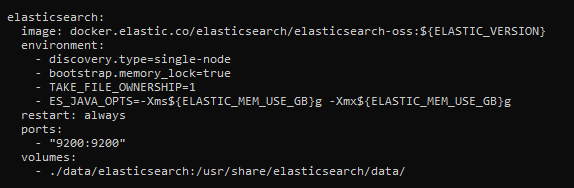
Now forward the ES port outside of the docker container so that Kibana can reach it.
$ sudo nano /opt/timesketch/docker-compose.ymlAdd the ports section specifying the forwarded port to the elasticsearch section.
warning
The above configuration is suitable only for your own test version of ES that cannot be accessed by anybody else. ES has no built-in authentication mechanisms; so, anyone can easily get access to the entire database. If you need a similar solution for production purposes, use the X-Pack extension.
Time to add Kibana. The above screenshot indicates that the project uses elasticsearch-oss:; accordingly, you need the same version of Kibana. Download and install kibana-oss:
$ wget https://artifacts.elastic.co/downloads/kibana/kibana-oss-7.10.2-linux-x86_64.tar.gz$ tar -xzf kibana-oss-7.10.2-linux-x86_64.tar.gz$ cd kibana-7.10.2-linux-x86_64Edit the config so that you can reach the Kibana interface:
$ nano config/kibana.ymlUncomment the server. parameter and specify the IP address of your VM. Start Kibana and check if everything works fine.
$ /bin/kibanaNow all you have to do is create users and log into the system.
$ sudo docker-compose exec timesketch-web tsctl add_user --username user1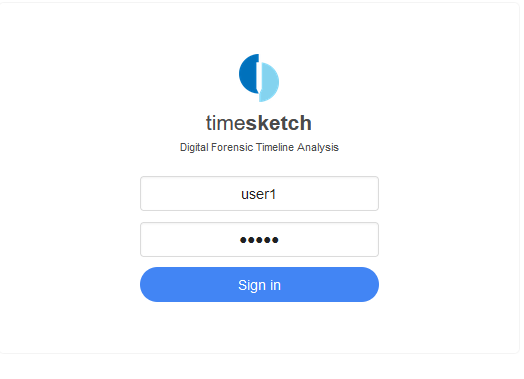
Usage
Create a new sketch (the New button) and upload the data generated last time to it (the Upload button). (I created two sketches and uploaded the data to each of them.) Then go to Kibana, and execute the following command in the dev section:
GET /_cat/indicies?v
As you can see, ES creates a separate index for each sketch; this index contains events from each uploaded Plaso file. In other words, the same Plaso file uploaded to different sketches will be processed multiple times.
Let’s see how the data are mapped to get an idea how to analyze them.
GET /9024dbca65494d1da2dc4758b169f1d9/_mappingAll text data are mapped according to the following scheme:
{ "type": "text", "fields" : { "keyword": { "type" : "keyword", "ignore_above" : 256 } }}If you are familiar with ES, you know that it uses dynamic mapping. This scheme is used because the developers are too lazy Timesketch can load absolutely any sequence of events from various sources, and it’s virtually impossible to develop a universal mapping scheme with suitable names for all fields. On the other hand, such a scheme makes it possible to perform full-text searches, aggregate data, and sort them by each field in the index. This approach provides plenty of advantages (provided that you know how to use it and don’t care that the number of free gigabytes on your hard drive drops dramatically).
Below if a brief overview of Timesketch tools.
Explore
This tab is your main tool that searches events in a timeline, applies filters, and constructs graphs. You can add comments to events, create notes, and save your search discoveries as new views for subsequent usage in Stories.
info
Since each sketch is represented in ES by a separate index, you may not worry about damaging other people’s comments or notes contained in another sketch. This feature is extremely important for multiuser forensic systems, and this is the reason why the Timesketch data storage system involves repeated loading and duplication of stored data.
Prior to reviewing individual events, let’s try to examine the entire sketch visually. To do so, move the Chart slider under the search box to the “on” position and look at the diagram of events constructed by the program.
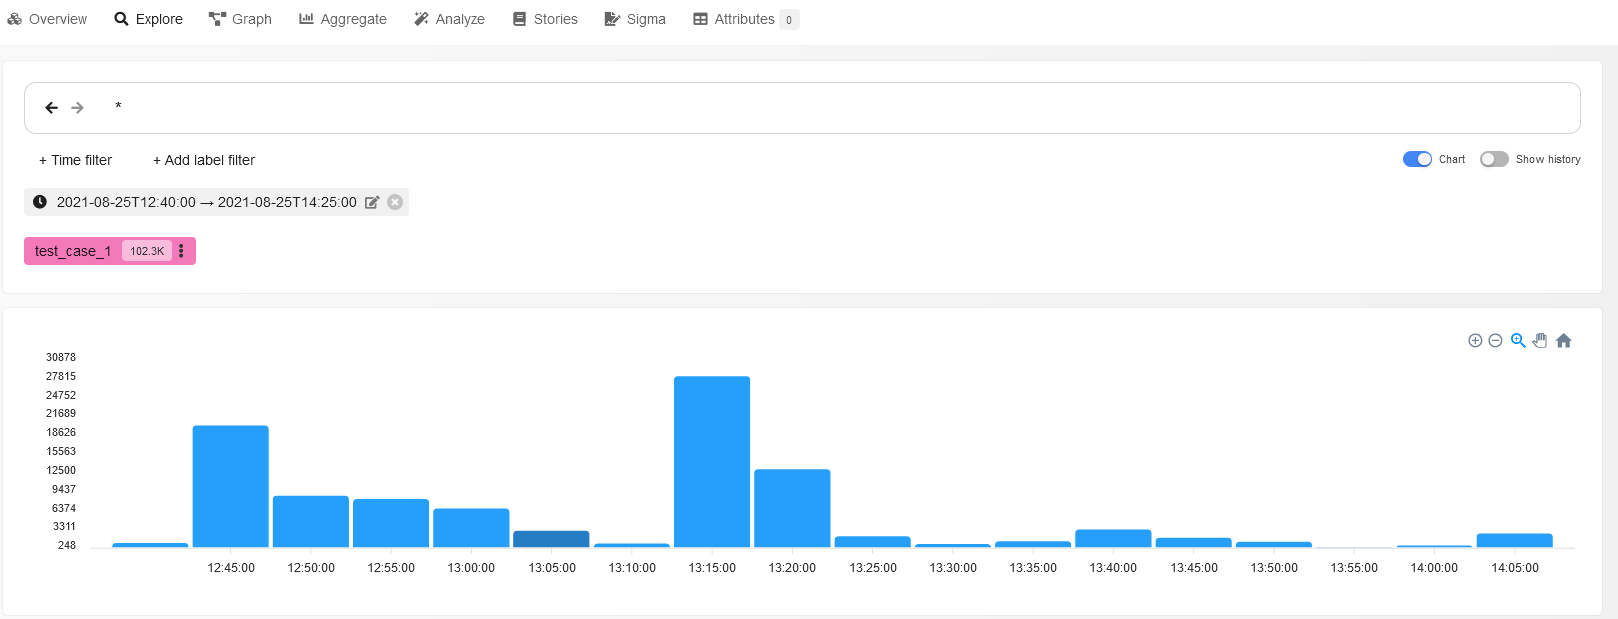
The highest bar indicates that multiple events have occurred in the system at that moment; such moments are definitely important for forensics purposes. Click on it to apply a time filter and examine processes occurring at this moment in more detail.
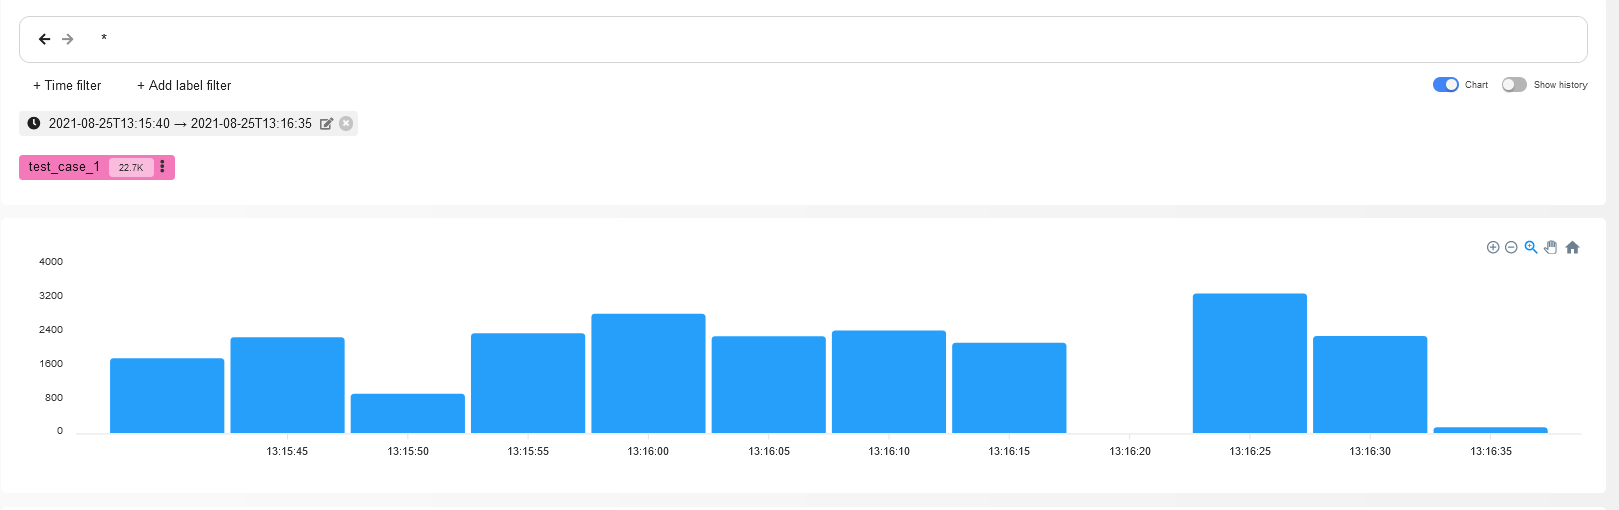
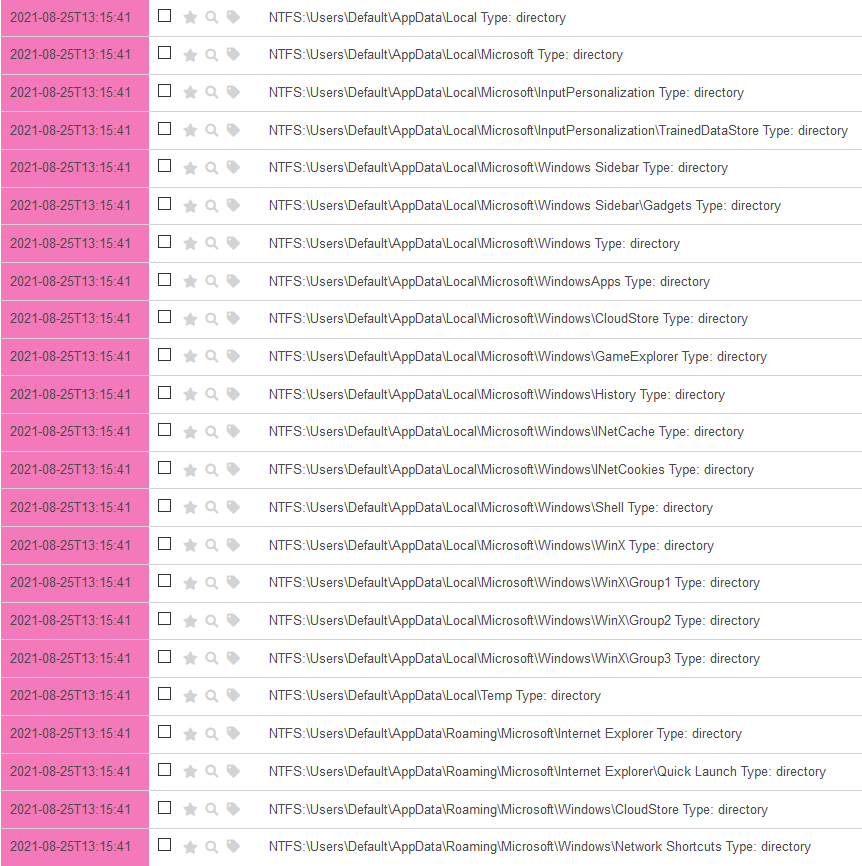
Amazing! It took you just two clicks to discover events described in the previous article. As you remember, your adversary was traversing the disk contents using an automation tool in search of something of interest.
To save this search, press the button of the same name. Time to find out whether the malefactor has found something important.
As you are likely aware, users often store (or forget to delete) important information on the Desktop, in the Downloads folder, and in other similar places. Cybercriminals, who are always short of time, usually collect user’s personal information in the same order by moving from simplest and most common situations to complex and rare ones.
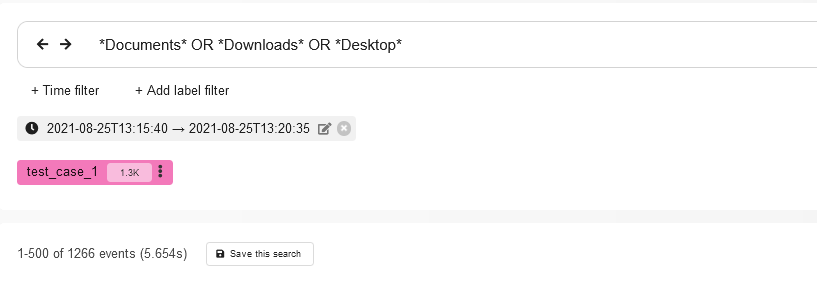
Let’s add 5 minutes to the current time filter (after all, the attacker needs some time to figure out what to steal from the victim’s computer) and write the following query in the search box:
*Documents* OR *Desktop* OR *Downloads*
The output contains 1266 events. Let’s examine the available information about these events.
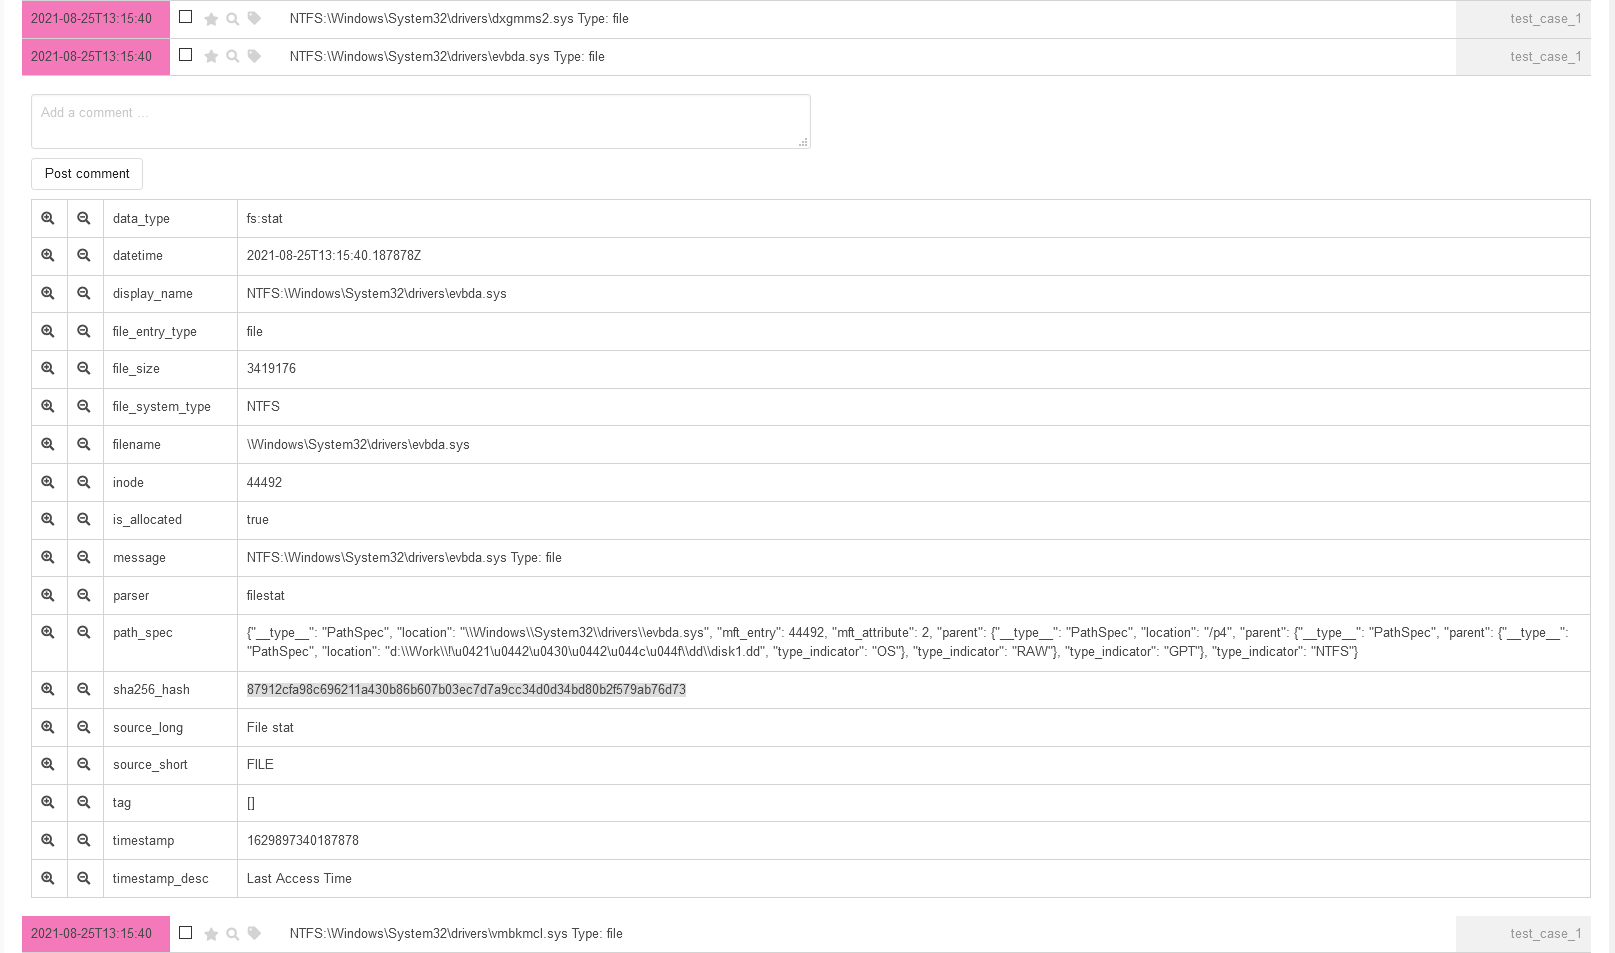
One of the key fields for each event is parser: it allows you to understand where did Plaso get it from. It’s also convenient to filter the type of events in the output by clicking on the button in the first or second column (which equals to the application of logical AND or NOT in the query).
Let’s use this feature. Since you generally understand the algorithm used to find interesting files in the file system (traversing all directories and subdirectories, getting the list of files from them, and gaining access to the files of interest), you can try to find out whether any files were stolen. Select any event with the parameters parser: and file_entry_type: and add them to the filter with the parameters AND and NOT.
This is equal to the following query:
(*Documents* OR *Desktop* OR *Downloads*) AND parser:filestat AND NOT file_entry_type:directory
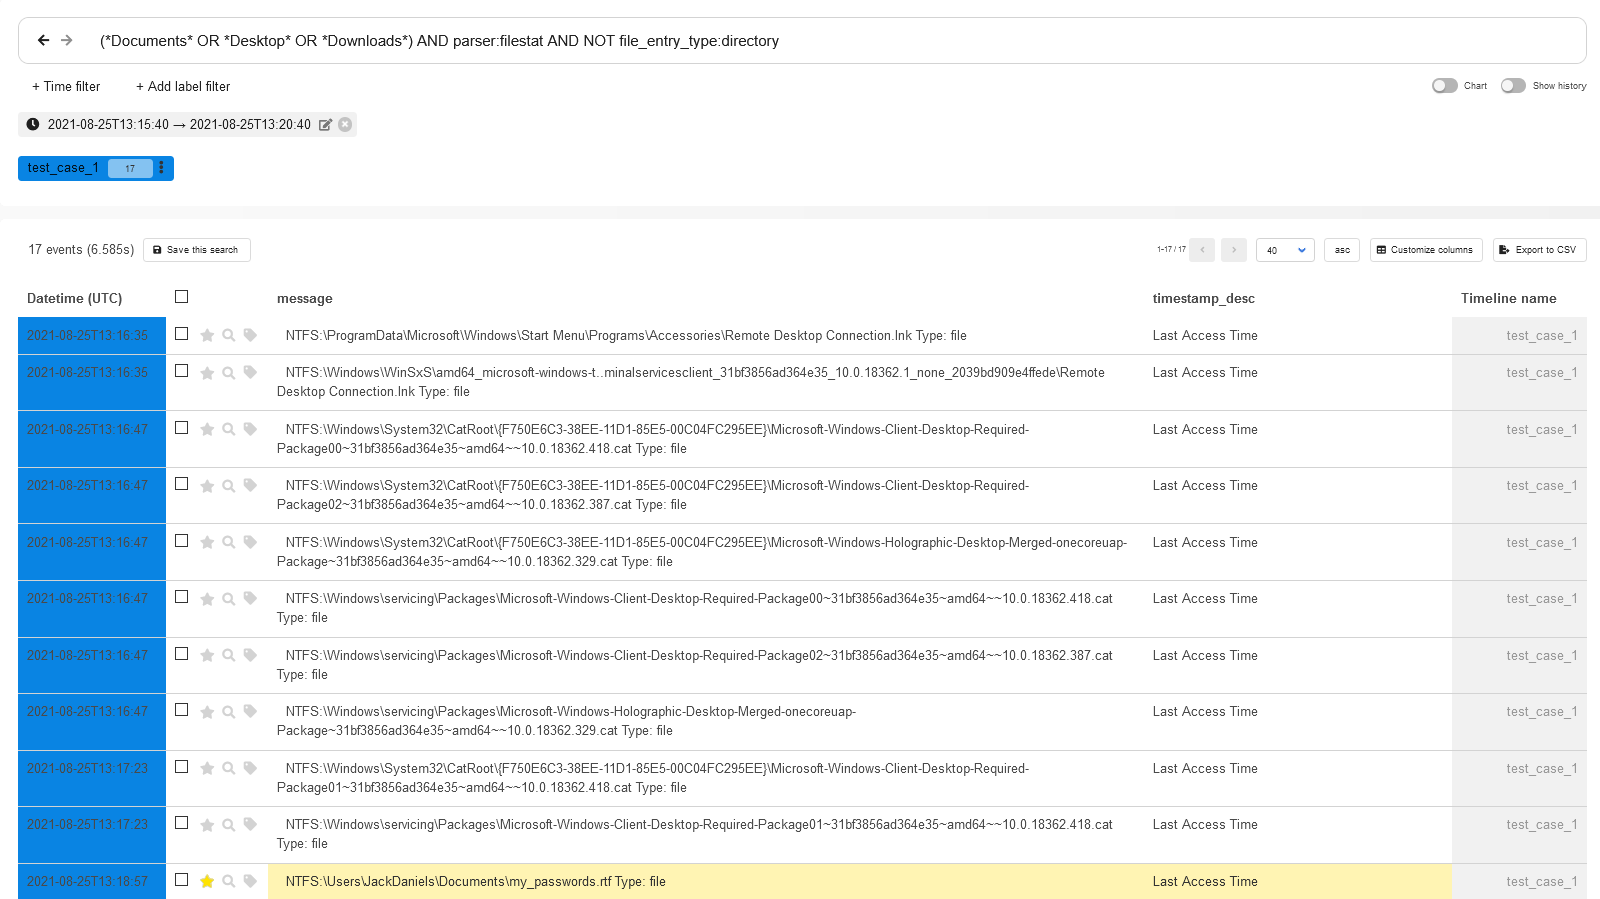
$Voila!$ You have got 17 events, and they include access to the file my_passwords. containing user passwords. You can now request the user to change all passwords to all services ASAP.
info
The collected events have nothing to do with logs deleted using the clearev command from Meterpreter.
Last time, you have learned about the possible incident on the test PC from its fictitious user. Now it’s time to figure out on your own how it became possible that the attacker gained access to the user’s passwords. For this purpose, Plaso offers an extremely efficient parser called prefetch and a respective data type:
data_type:windows:prefetch:execution
info
Prefetcher is a Windows component optimizing the launch of executable files in the system. It creates special data structures that are stored on disk in the Windows\ directory. Similar to logs, prefectch files are a goldmine of information for a forensic specialist.
Let’s use this data type as a filter and exclude (just for the first examination) all executable files that were launched from the Windows or Program directories from the output. The query in this case will look as follows:
data_type:windows:prefetch:execution AND NOT path_hints: "WINDOWS" OR NOT path_hints: "Program"
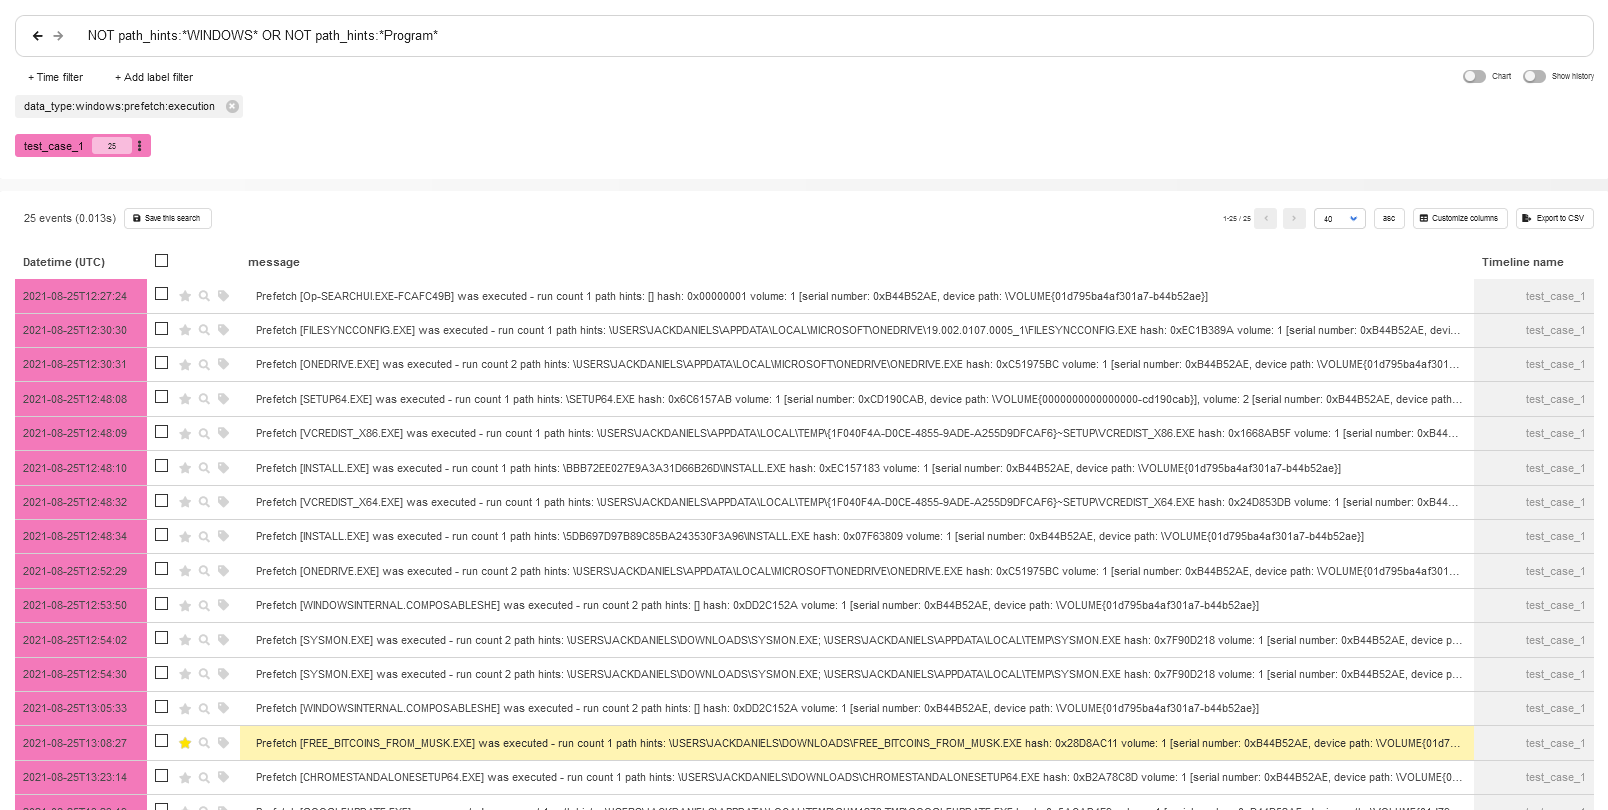
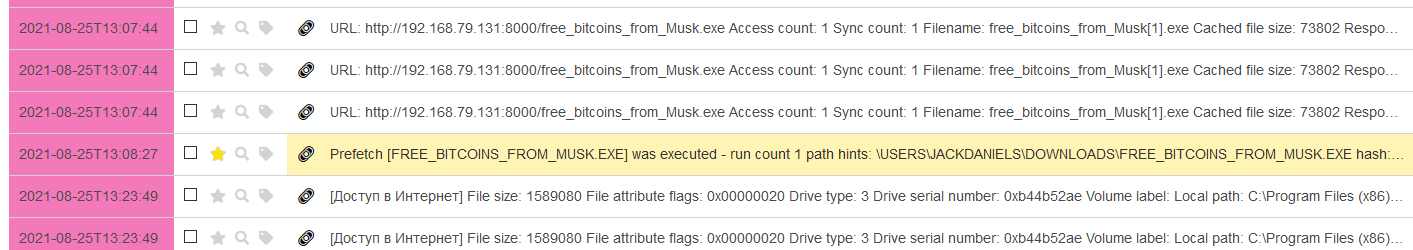
With one simple query, you see in the first 25 events that a file with a tempting name was launched from the Downloads folder.
Homework assignment
Wanna find out what techniques were used by the attacker to create a foothold in the system? Take my CSV file, upload it to Timesketch, and try your hand!
- Hint 1: The attacker used 2 tricks!
- Hint 2: To identify them, you’ll need a query 11 characters in size.
Aggregate
So, how it happened that despite attacker’s attempts to cover up all the traces, the facts still came out? The answer is in the Aggregate tab.
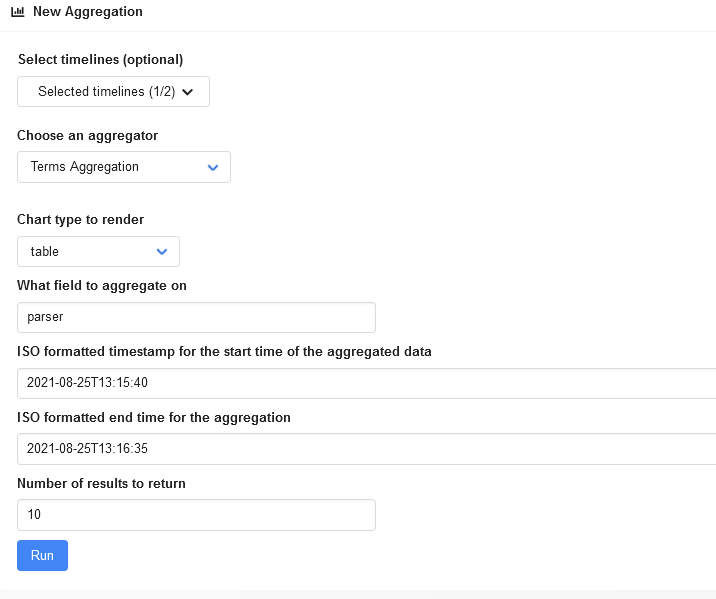
This tab makes it possible to group events that are of interest to you, display statistics for the applied filters, construct tables and graphs, and find anomalies in groups of events.
To find out what events occurred at the moment when the attacker started searching the file system for interesting files, select the parser field as the grouping one and set the previously defined time frames.
The output is as follows.
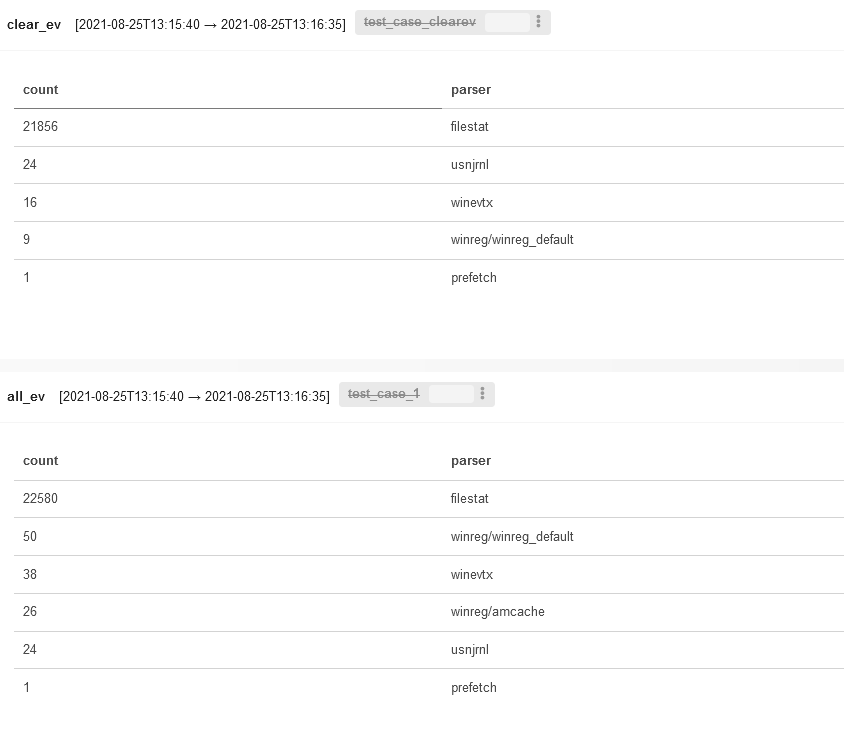
Expectedly, most events were extracted from the filestat parser (i.e. these are filesystem events, and clearev cannot clean them up). The winreg/ parser is useless in this case because the images were created at different times. Accordingly, events recorded in amcache. were simply overwritten with more recent ones. So, the problem in this case is rather in the experimental accuracy, not in some miraculous capabilities of Meterpreter.
Note that you can click on graphs constructed in the current tab. When you click on an element, the Overview tab opens, and the required filters are immediately applied.
In addition, graphs that deserve further examination can be saved in Stories by clicking the respective button.
Analyze
Analyze is one of the most important tabs; in fact, most investigations start with it. Timesketch offers a large set of built-in analyzers that can automatically tag various groups of events indicating something unusual and potentially requiring your attention. All analyzers are located in the / directory and are written in Python. Analyzers available out of the box can perform the following operations:
- work with search queries made in the browser (you will immediately see where, what, and when the user was looking for);
- detect activities performed outside of the user’s normal working hours (such activities are determined statistically);
- identify chains of linked events (e.g. downloading and launching executable files, copying and archiving exfiltration files, etc.);
- detect attempts to clean up logs;
- analyze RDP connections; and
- detect attempts to brute-force passwords.
info
See the Overview tab for analysis results. Just click the three vertical dots on the timeline you are interested in and select Analyzer from the drop-down list.
If necessary, you can create a new analyzer. To check whether it’s operational, use the script analyzer_run. stored in the test_tools directory. Feed to it the CSV file with events and your hello_world_analyzer..
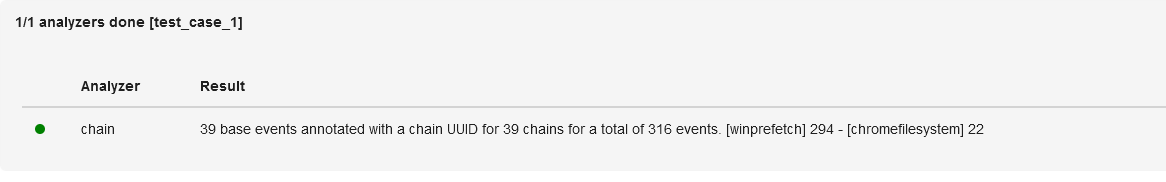
Let’s see how the built-in Chain Linked Events analyzer can help in your investigation. Select your test timeline and the respective analyzer and launch the process.
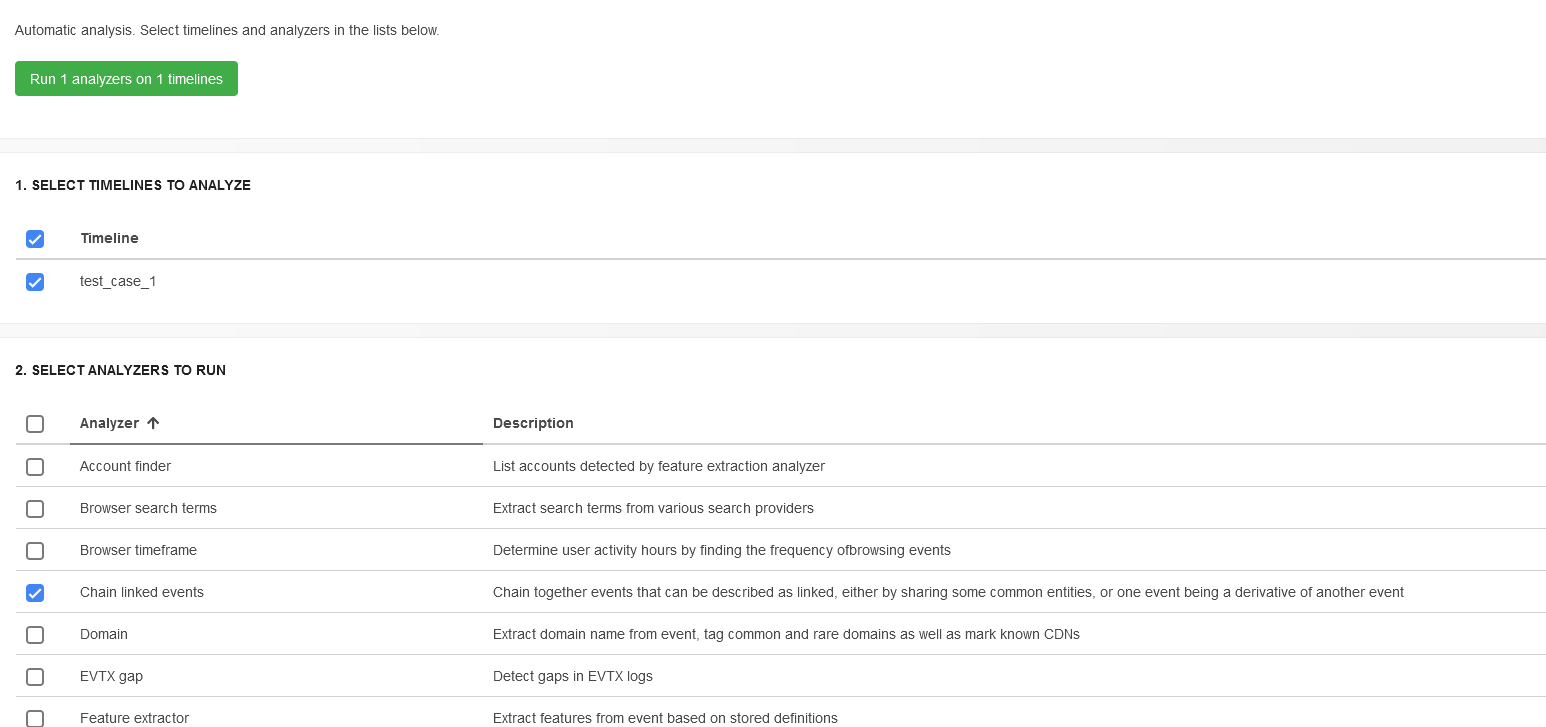
To view linked events, type the following query in the search box:
chains:*
After scrolling the response down a little, you’ll see the executable file downloaded and launched by the careless user.
Each chain of events has its own identifier stored in the chains field. Accordingly, you can use these identifiers to find the required chains.
Stories
The Stories tab enables you and your colleagues to describe the discovered events. The information collected by joint efforts is more comprehensive; if necessary, you can insert saved queries and constructed graphics using Markdown markup. Some analyzers automatically generate stories based on the obtained results.
Generally speaking, Stories are ready-made fragments of the future timeline analysis report.
Conclusions
Timesketch is a wonderful tool that turns boring analysis of CSV files into an exciting cybercriminal investigation. The next article will be dedicated to a new technology called Sigma that is supported by Timesketch since recently. Among other things, you will learn how to write rules for it and use them in Timesketch.
While this information looked useful the missing information (e.g. “If everything is OK, the output should be something like this.” the output is missing, and “Add the ports section specifying the forwarded port to the elasticsearch section.” does not show an example) makes it a guessing game for the setup process for those following along
Links to pictures have been fixed.