In March 2019, the National Security Agency of the US Department of Defense (NSA) has published Ghidra, a free reverse engineering toolkit. A couple of years ago, I had read about it on WikiLeaks and was eager to lay hands on the software used by the NSA for reverse engineering. Now the time has come to satisfy our curiosity and compare Ghidra with other tools.
[panel]
The problem of trust
The NSA has published the source codes of 32 projects under the Technology Transfer Program (TTP). The full list of projects is available on GitHub. The trolls were making jokes about the NSA using these programs to spy on the spies, and not on their victims. On the one hand, the source code of the products is open. The experts who are using them are skilled enough to check the software for any vulnerabilities. On the other hand, the first bug was identified immediately after the release of Ghidra.
British information security expert Matthew Hickey, Cofounder and Director of Hacker House, noted that Ghidra toolkit opens port 18001 on your local network in debugging mode and puts a listener on it. This enables Ghidra to establish a remote connection via JDWP; of course, for debugging purposes only. According to Hickey, it is easy to solve this problem: all you have to do it change line 150 in the support/launch.sh file from * to 127.0.0.1.
Over time, other bugs started popping up. For instance, experts found an XML external entity (XXE) vulnerability that could be exploited by attackers that are able to trick a Ghidra user into opening or restoring a specially crafted project. Therefore, be cautious!
[/panel]
Ghidra can be downloaded from its official Web site ghidra-sre.org, but there is a problem: the site cannot be accessed from some countries outside of the US (including Canada). However, I believe that this won’t stop our international readers; VPN and Tor are hackers’ best friends.
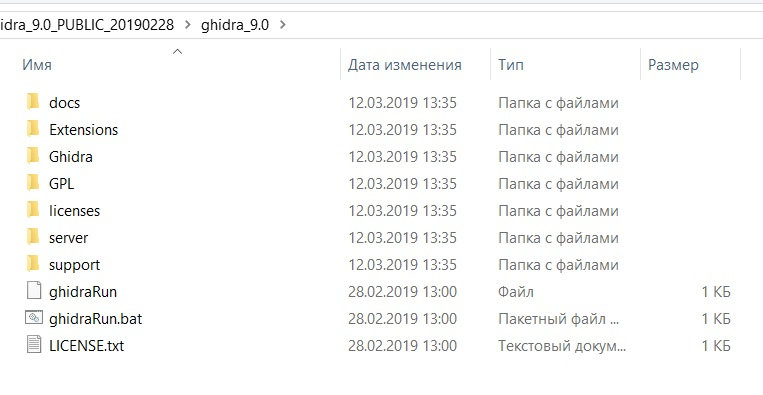
So, you have downloaded and unpacked the ghidra_9.0_PUBLIC_20190228 archive. Let us go through the main folders and look what is inside.
First, I strongly recommend to review the docs directory. It contains plenty of slides and PDF files with information about Ghidra, its plugins and features.
There is nothing of interest in the Licenses folder. The Server folder contains tools required to launch a remote debug server. The Support folder stores additional tools required to run the program.
The Ghidra folder is more interesting: the Processors subdirectory provides a full list of supported architectures, which include 6502, 68000, 6805, 8051, 8085, AARCH64, ARM, Atmel, CR16, DATA, JVM, MIPS, PA-RISC, PIC, PowerPC, Sparc, TI_MSP430, Toy, x86, and Z80.

Now it is time to examine the application! To launch Ghidra under Windows, run ghidraRun.bat. Linux users will launch ghidraRun.sh. The project is largely based on Java; therefore, make sure you have the Java Runtime installed.
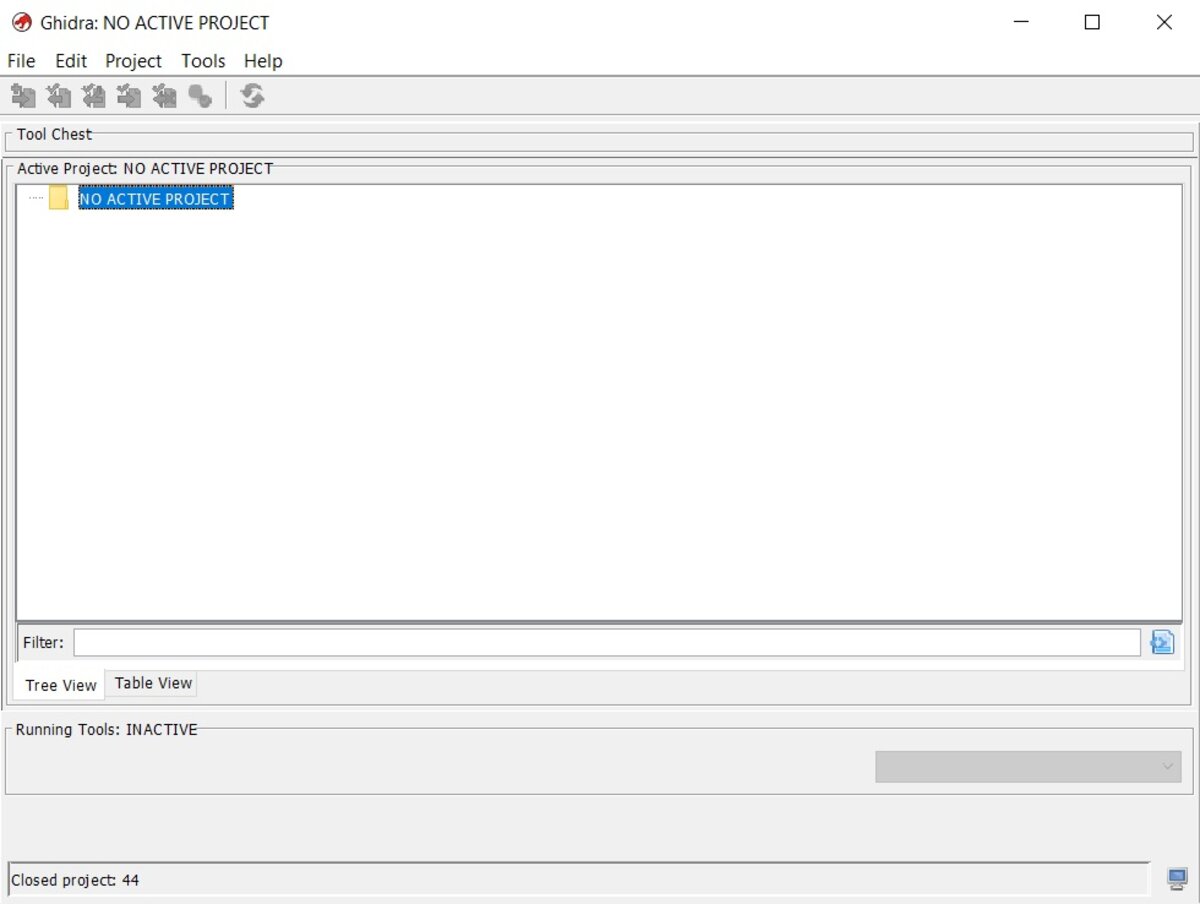
First, the program offers to create a project and add the required binary files for analysis. Then the icon with a green dragon becomes active and opens the CodeBrowser, our main working environment.
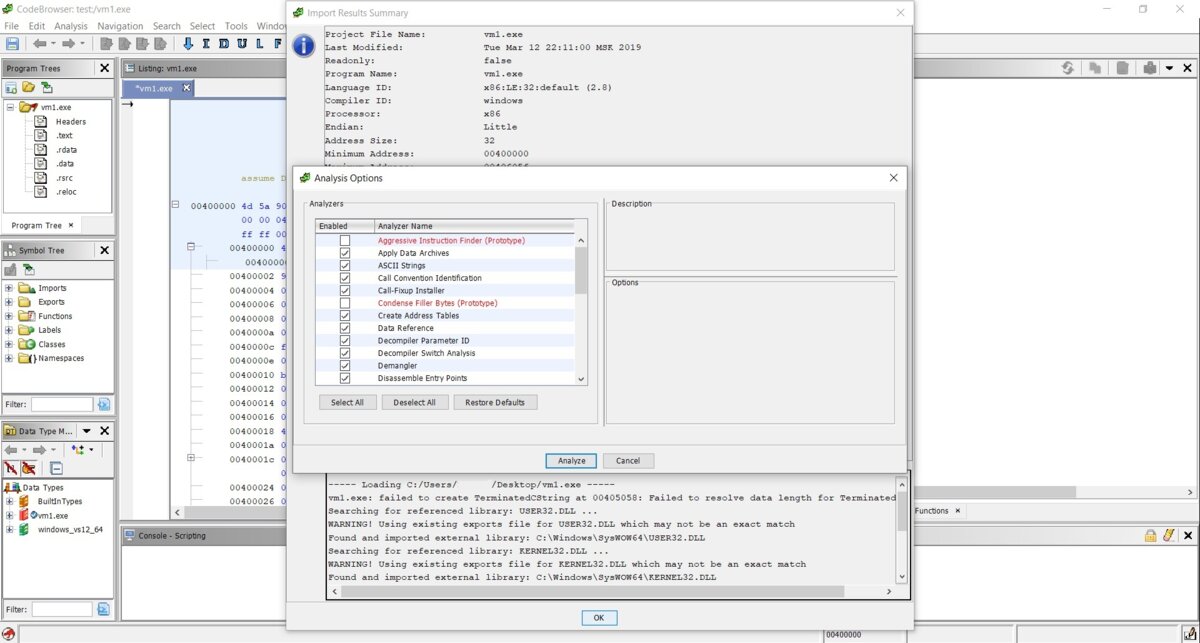
Initially, we are presented with a window showing the file’s technical information. The tool prompts us to analyze it and select the analysis options. We’ll accept the prompt. The main interface looks unusual, at least for me.
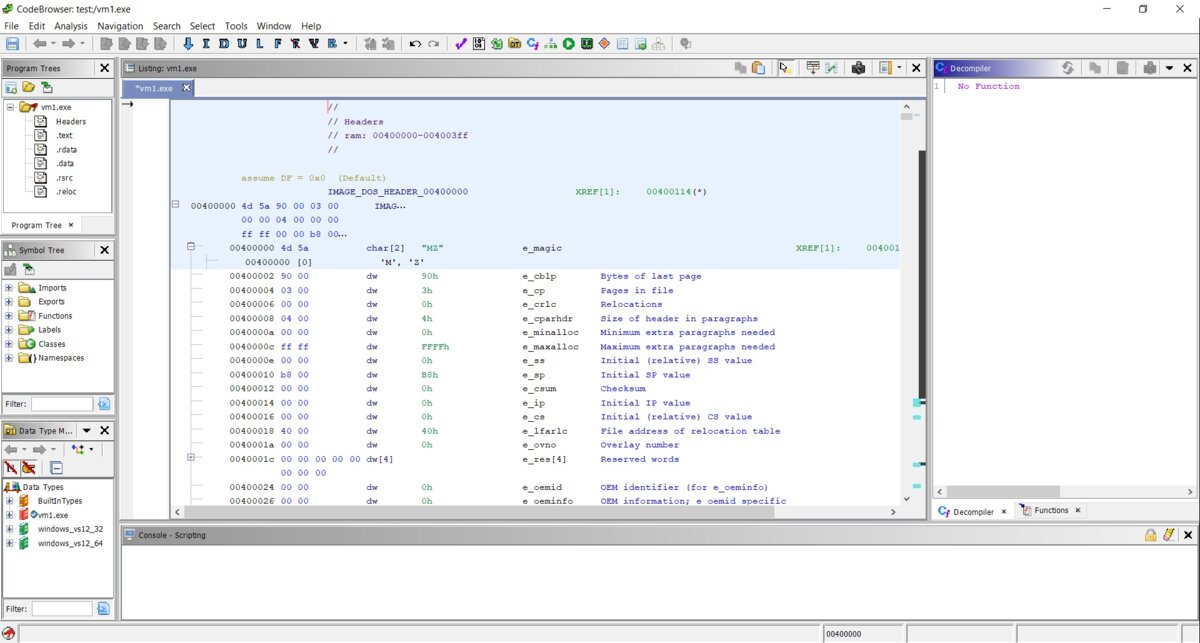
Finally, we can analyze the file header. What we see is the IMAGE_DOS_HEADER structure, which is not an entry point. I can observe that all the fields are displayed correctly, and everything looks nice and makes sense.
[panel template=info]
During the first launch, the code and other fields in the many windows of the disassembler had a very unusual layout. This was an easy fix. The visual elements in the Disassembly Listing (“disasm” view) can be customized using the “Edit the listing fields” button in the upper-right corner.
[/panel]
The Decompiler window is on the right, we’ll get back to it later. There is also Functions tab in the bottom-right part of the screen, let us press it.
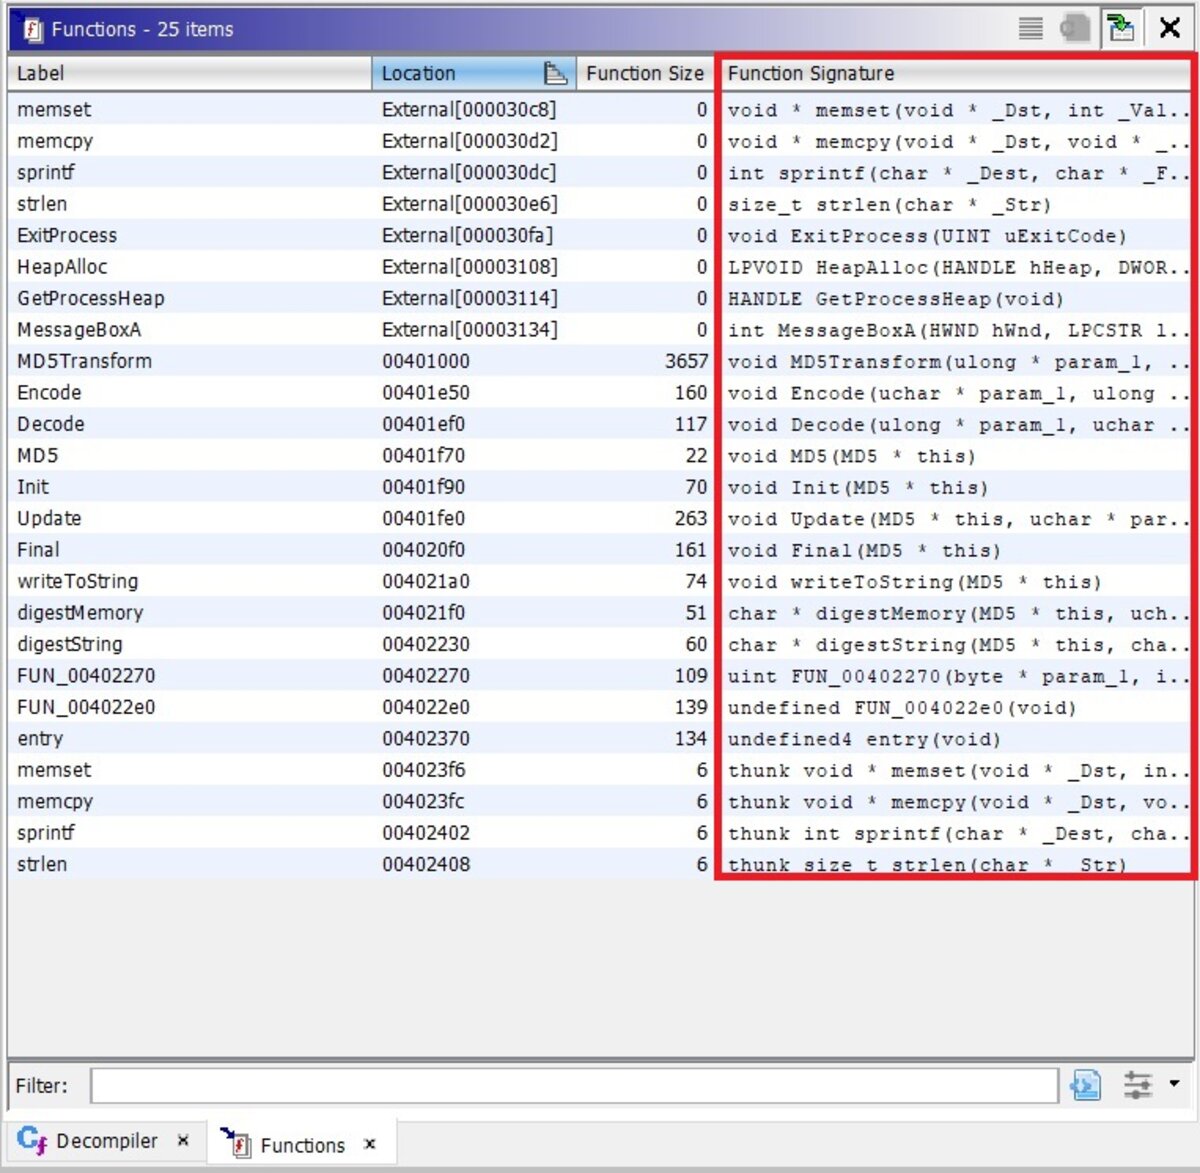
Here we see the list of functions with their signatures, which is very handy. Let us select a function and see what happens next.
[xakepcut]
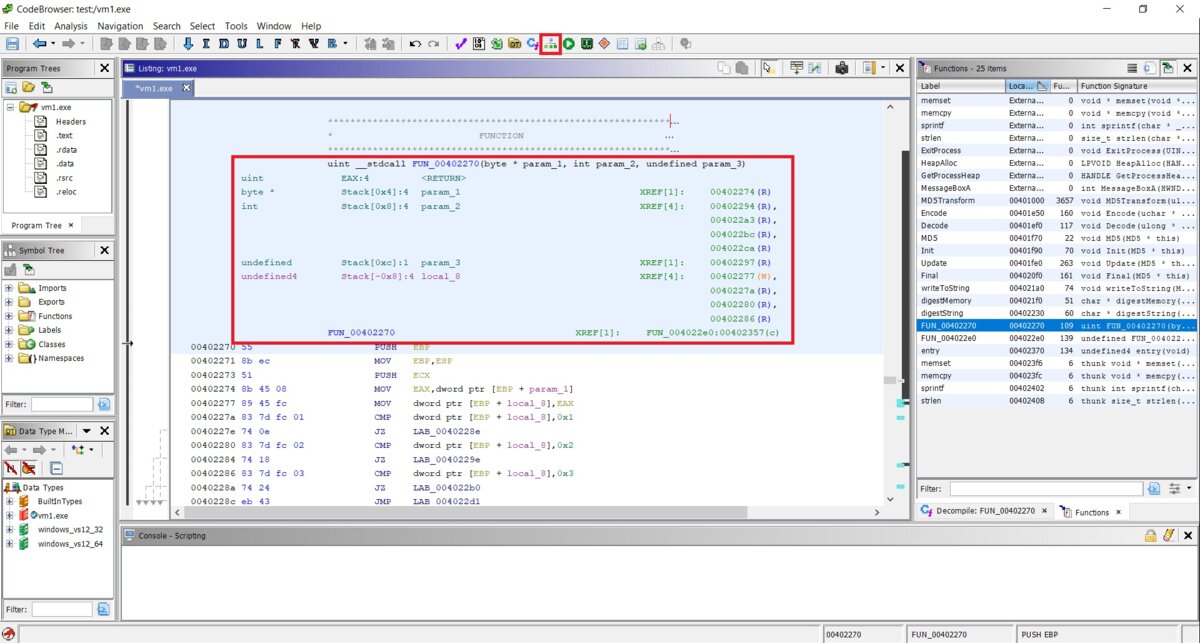
This is the very beginning of the function, containing its signature, parameters and their types, return value, calling conventions, and disassembly listing. The Display Function Graph button is located on top of the screen; I highlighted it on the screenshot. Let us press it.

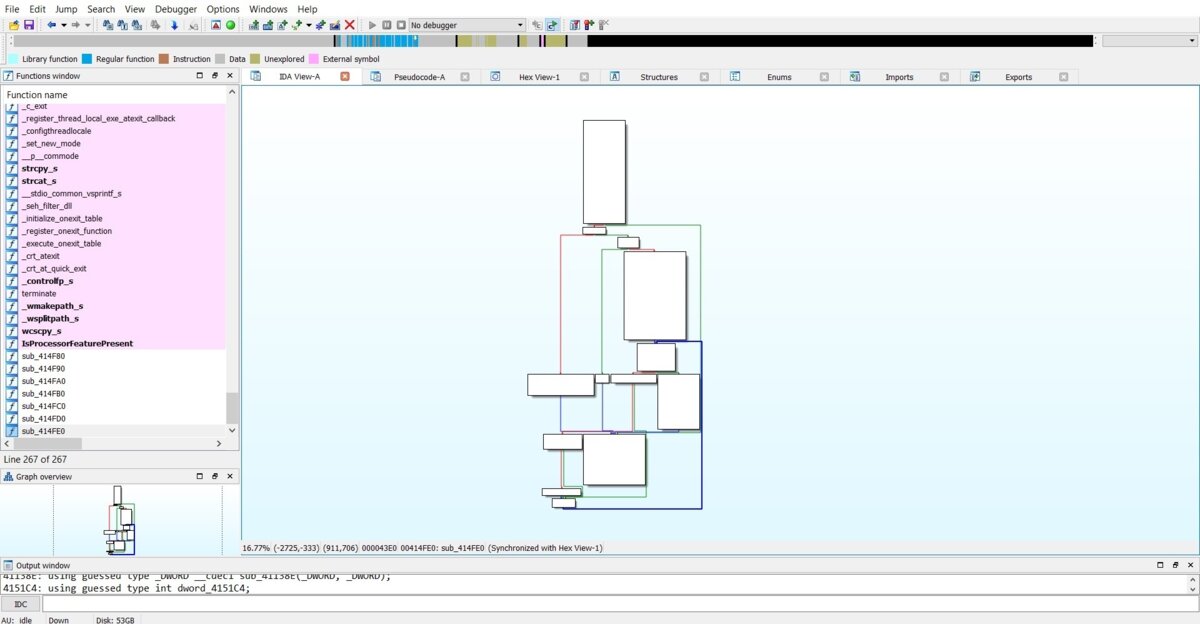
A nice animation appears when you move the cursor over the code blocks (it can be seen on the screenshot). I made two screenshots of the same function graphically presented by both Ghidra and IDA Pro. In my opinion, the graph generated by Ghidra is more informative. In addition, Ghidra marks constructions such as if… else on the graph. I understand that this may sound childish, but for me personally, the code visualization in Ghidra is more informative and convenient than that in IDA Pro. Furthermore, the function graph is highly customizable.
Ghidra also offers lots of searching functionality; to see all available options, you just have to select Search in the framework menu and review the dropdown list. For instance, this is how the string search dialog looks:

Ghidra is able to compute cross references to and from almost any item (string, instruction, register, etc.). To use this function, select References in the context menu and specify what are you looking for. Furthermore, in the beginning of every function, Ghidra attempts to display cross references to it.
Ghidra includes a built-in hex viewer; to toggle the hex view, you have to open the Windows → Bytes menu.
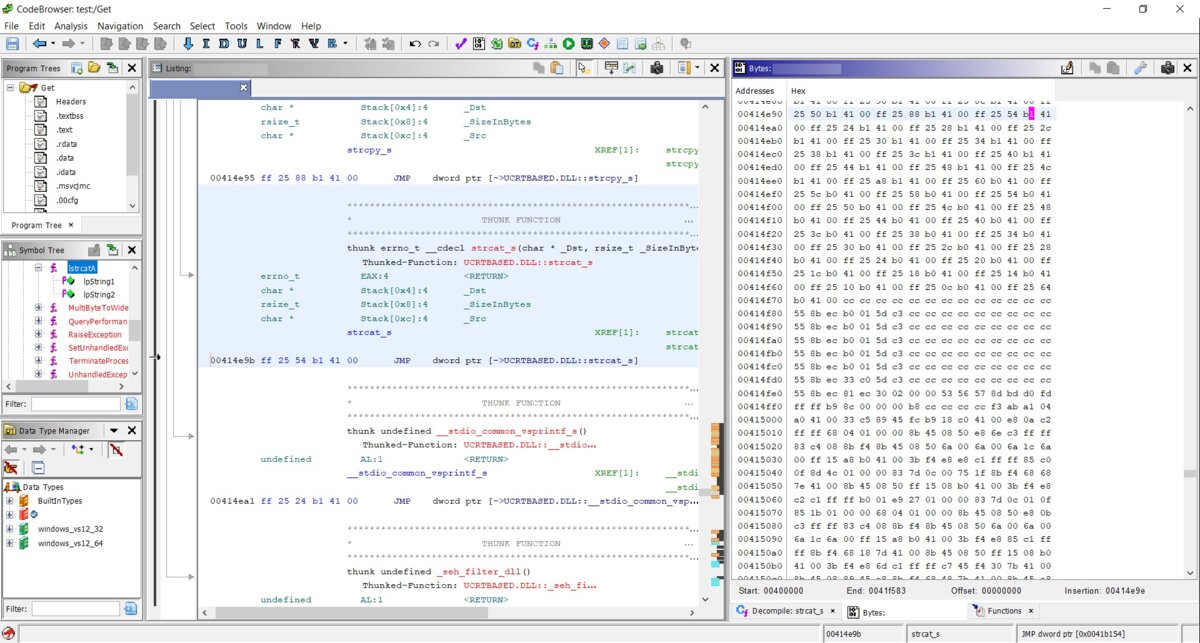
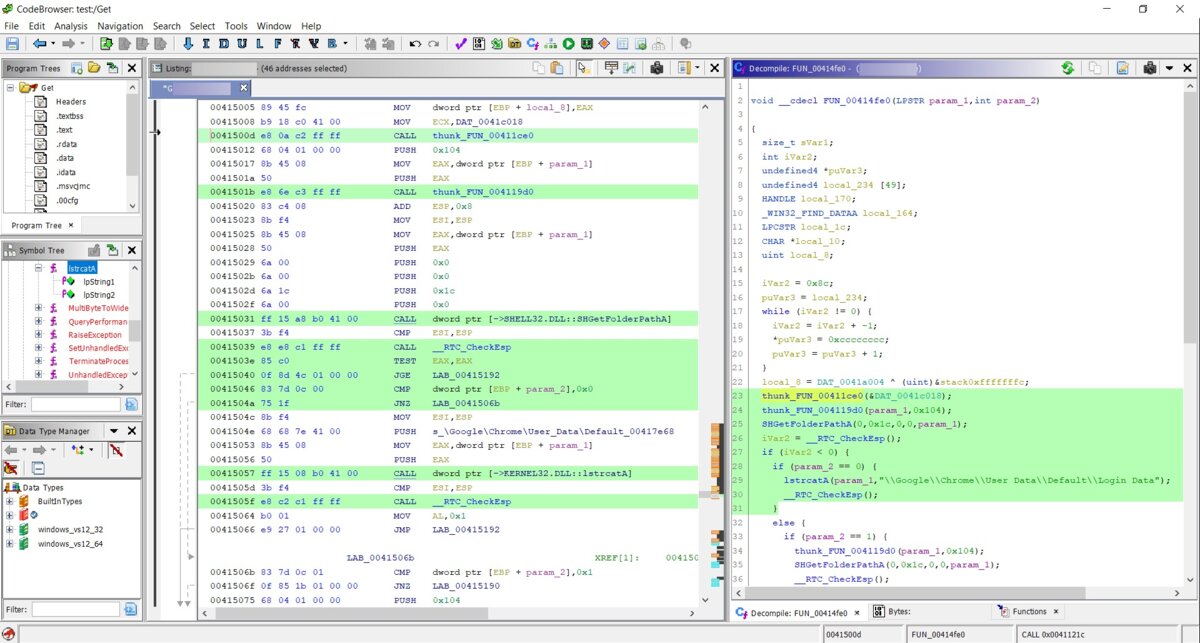
Ghidra supports the assembly code patching function straight out of the box. To use it, select a code line and press Ctrl + Shift + G or, alternatively, select Patch Instruction in the context menu. There is an interesting visual feature in the program: if you select some code in the Decompiler window, that piece of code is automatically selected in the Disassembly Listing window.
Another exciting feature is that Ghidra, out of the box, ships with a Script Manager – a set of scripts suitable for all occasions. Of course, if some script is missing, you can add it. All scripts are written in Java. Just for information, see below the full listing of the CreateExportFileForDll.java script whose name is self-explanatory. 🙂
import generic.jar.ResourceFile;
import ghidra.app.script.GhidraScript;
import ghidra.app.util.opinion.LibraryLookupTable;

public class CreateExportFileForDLL extends GhidraScript {
  @Override
  public void run() throws Exception {
    // Push this .dll into the location of the system .exports files.
    // Must have write permissions.
    ResourceFile file = LibraryLookupTable.createFile(currentProgram, false, true, monitor);

    println("Created .exports file : " + file.getAbsolutePath());
  }
}
The scripts can be edited in the simple built-in editor or opened in IDE Eclipse directly from the context menu. Of course, if you want to use that, then you must have Eclipse installed on your PC.
Overall, there are plenty of useful functions, including a built-in binary diff tool and the possibility to patch code without any additional plugins, view the code entropy, and build the program’s function call tree in the application. The toolkit also includes a built-in Python interpreter (i.e., unlike IDA, you don’t have to install it separately) and other handy features.
Now let us examine the decompiler, which, unlike IDA, is shipped with the package. First, I am going to present the listing generated by the Ghidra’s decompiler and then the listing produced by IDA Pro.
Here is the listing generated by Ghidra:
undefined8 FUN_1400010b0(void)
{
  ushort uVar1;
  longlong *plVar2;
  LPCSTR lpMultiByteStr;
  ushort *puVar3;
  longlong *plVar4;
  longlong in_GS_OFFSET;
  ushort local_d8 [104];

  plVar2 = *(longlong **)(*(longlong *)(*(longlong *)(in_GS_OFFSET + 0x60) + 0x18) + 0x18);
  lpMultiByteStr = FUN_140001448(&DAT_140003000);
  MultiByteToWideChar(0,1,lpMultiByteStr,-1,(LPWSTR)local_d8,100);
  plVar4 = plVar2;
  do {
  plVar4 = (longlong *)*plVar4;
  if (plVar4[6] != 0) {
    puVar3 = local_d8;
    while( true ) {
      uVar1 = *(ushort *)((plVar4[0xc] - (longlong)local_d8) + (longlong)puVar3);
      if ((uVar1 == 0) && (*puVar3 == 0)) goto LAB_140001140;
      if ((uVar1 < *puVar3) || (uVar1 >= *puVar3 && uVar1 != *puVar3)) break;
      puVar3 = puVar3 + 1;
    }
  }
  } while (plVar2 != plVar4);
  LAB_140001140:
  return plVar4[6];
}
This is the listing produced by the IDA Pro Hex-Rays Decompiler:
__int64 sub_1400010B0()
{
  unsigned __int64 v0; // rax
  _QWORD *v1; // rdi
  _QWORD *v2; // rbx
  const CHAR *v3; // rax
  WCHAR *i; // rax
  WCHAR v5; // cx
  WCHAR WideCharStr; // [rsp+30h] [rbp-D8h]
  v0 = __readgsqword(0x60u);
  v1 = *(_QWORD **)(*(_QWORD *)(v0 + 24) + 24i64);
  v2 = *(_QWORD **)(*(_QWORD *)(v0 + 24) + 24i64);
  v3 = (const CHAR *)sub_140001448(&unk_140003000);
  MultiByteToWideChar(0, 1u, v3, -1, &WideCharStr, 100);
  while ( 1 )
  {
    v2 = (_QWORD *)*v2;
    if ( v2[6] )
      break;
    LABEL_9:
    if ( v1 == v2 )
      return v2[6];
  }
  for ( i = &WideCharStr; ; ++i )
  {
    v5 = *(WCHAR *)((char *)i + v2[12] - (_QWORD)&WideCharStr);
    if ( !v5 && !*i )
      break;
    if ( v5 < *i || v5 > *i )
      goto LABEL_9;
  }
  return v2[6];
}
In my opinion, the listing produced by Ghidra is easier to read. I know that the Hex-Rays Decompiler is easily customizable. Furthermore, it has the HexRaysPyTools plugin, making the result even better. But we are currently discussing the tools supplied with the package, while Hex-Rays will cost you extra money.
Anyway, the Ghidra’s decompiling module is very powerful, and it can easily compete with Hex-Rays. If you open the \Ghidra\Processors folder, select any architecture, and then go to \data\languages folder, you will see files with extensions *.slaspec, *.pspec, and some others. At that point, you will realize that you can now realistically write a support module for your specific architecture. And again, one of the main problems of IDA Pro is that its code is not open!
Conclusions
We have examined Ghidra’s reverse engineering framework. Can it replace IDA Pro? I doubt it; at least, not at its current stage. In my opinion, Java is not the best language for this kind of tools. And, of course, the operation speed does matter, too.
The disassembler is sluggish, especially with ‘heavy’ files. For instance, the reverse engineering of files over 150 MB using Ghidra is a true challenge. On the other hand, Ghidra is a cross-platform tool, which may be important for some users.
Another aspect is that IDA Pro supports many more architectures and file loaders than Ghidra. And, unlike IDA Pro, Ghidra is lacking the comprehensive integration with debuggers. Of course, the open source (provided that the NSA fulfills its promise) is a great thing, and the possibility to add support for other architectures is a really cool feature. But years may pass before this work is completed (and the bugs fixed).
Overall, I got a strong impression that Ghidra is not a finished product. In its current state, the framework resembles a publicly-available beta version, and not “version 9”. By the way, the package name includes the word “PUBLIC”, so we can safely assume that a “PRIVATE” version exists somewhere as well.
No doubt, Ghidra has its strengths; in some aspects, it has already surpassed IDA Pro, but the number of its weaknesses is much greater. On the other hand, IDA developers may adopt many features from the new toolset. For instance, I like the high informative value of the code visualization in graphs. The graph building seems to be more straightforward and orderly. The code patching is available without additional plugins and without the division between the x64 and x86. Why having two shortcuts on your desktop if one is sufficient? In other words, the creation of Ilfak Guilfanov has plenty of room for improvement.
