
What Causes Lag
Before we move on to tools and techniques for improving performance, let’s take a moment to understand where lag comes from and why an application can be slow. The main issues with modern applications are:
- excessively long app startup and individual screen load times;
- freezes: the app stops responding, and after a while the OS prompts the user to force close it;
- FPS drops: instead of smooth scrolling and animations, the user sees a slideshow.
The reason behind all these problems is straightforward: some operations run for too long—whether CPU-bound or I/O-bound—but the optimization strategies differ.
Cold Start
Starting an app goes through several stages: initializing a new process, creating a window to render the UI, showing that window on screen, and handing control over to the app’s code. After that, the app must build its interface from an XML layout, load assets needed for proper rendering from local storage or the internet (bitmaps, list and chart data, etc.), initialize additional UI components such as a navigation drawer, and attach callbacks to UI elements.
Obviously, this is a massive amount of work, and we should do everything we can to complete it as quickly as possible. The two main tools for the job are:
- Lazy initialization
- Parallel task execution
Deferred initialization means you should postpone anything that can be done later. Don’t create and initialize every piece of data and every object the app might ever need at startup. First initialize only what’s necessary to render the main screen correctly, then handle everything else afterward.
Complex, costly operations that you can’t optimize—along with blocking tasks like disk I/O or fetching data from a server—should be offloaded to a separate thread, and the UI should be updated asynchronously once they complete.
Example: you have an app that needs to show a summary of data from the internet on the home screen. The most obvious approach is to fetch the data from the server and then render the UI. And while Android by default doesn’t allow network requests on the app’s main thread—forcing you to use a background thread to fetch data—most developers will still try to keep the code flow sequential.
The problem with this approach is that it introduces unnecessary delays. Most of the time, the network thread will be idle waiting for data, and that time is better spent rendering the UI. In other words, right after the app launches you should start a thread to fetch data from the server, but don’t wait for it—build the UI immediately, using temporary placeholders for data that hasn’t arrived yet.
You can use placeholders like empty images, empty strings, or empty lists (for example, you can initialize a RecyclerView right away and just call notifyDataSetChanged( when data arrives). After fetching data from the server, cache it. On the next launch, you can use the cached data instead of placeholders.
This approach works well not just for network communication, but for any tasks that involve long-running computations and/or waiting on data. For example, a launcher needs quite a bit of time to ask the system for the list of installed apps, sort it, and load icons and other metadata into memory. That’s why modern launchers do this asynchronously: they render the UI first and then use a background thread to populate it with app icons.
Another bottleneck is building the UI from layout descriptions in XML. When you call setContentView( or a fragment’s LayoutInflater., Android looks up the target layout in its binary XML file (Android Studio packages XML into a binary format for efficiency), reads and parses it, and then constructs the UI from that data—measuring and laying out the views so they fit together.
This is a genuinely complex and costly operation. So you should pay close attention to layout optimization: avoid excessive layout nesting (for example, use RelativeLayout instead of stacking multiple LinearLayouts), and split complex UI definitions into smaller pieces, loading them only when needed.
Another option is to switch to Kotlin and use the Anko library. It lets you define the UI directly in code, which can boost rendering speed fourfold and gives you greater flexibility in controlling the UI construction logic.
Stutters and Frame Rate Drops
On Android, only the app’s main thread is allowed to update the UI and handle touch input. This means that if your app is doing heavy work on the main thread, it can’t respond to taps and will appear frozen to the user. The fix is to move expensive operations to separate background threads.
There’s a much subtler, less obvious point. Android redraws the screen at 60 FPS, which means it has just 16.6 ms to render each frame during animations or scrolling. Most of the time it keeps up without dropping frames, but a poorly written app can bog it down and cause stutter.

A simple example: RecyclerView is a UI component that lets you create extremely long scrollable lists while using the same amount of memory regardless of the list’s length. This is possible because it reuses the same sets of UI elements (ViewHolders) to render different list items. When an item scrolls off-screen, its ViewHolder is moved to a cache and then reused to display subsequent items.
When RecyclerView pulls a ViewHolder from its cache, it calls your adapter’s onBindViewHolder( to bind it with data for a specific list item. Here’s the catch: if onBindViewHolder( does too much work, RecyclerView won’t have time to prepare the next item for display, and the list will start lagging or stuttering during scrolling.
Another example: you can attach a custom RecyclerView. to a RecyclerView, whose onScrolled( method is called whenever the list is scrolled. It’s commonly used to dynamically hide and show the round action button in the corner (FAB — Floating Action Button). But if you put heavier logic into this method, the list will start to lag and stutter.
And here’s the third example. Suppose your app’s UI consists of multiple fragments that you can switch between using a side menu (Drawer). The most obvious way to solve this seems to be to put something like the following into the menu item click handler:
// Switch the fragment
getSupportFragmentManager
        .beginTransaction()
        .replace(R.id.container, fragment, "fragment")
        .commit()
// Close the Drawer
drawer.closeDrawer(GravityCompat.START)
It all makes sense, but if you run the app and test it, you’ll see the menu close animation stutter. The issue is that commit() is asynchronous, so fragment switching and menu dismissal happen simultaneously, and the phone doesn’t have time to process all the UI updates smoothly.
To avoid this, switch the fragment only after the menu’s close animation has finished. You can do that by attaching a custom DrawerListener to the menu:
mDrawerLayout.addDrawerListener(new DrawerLayout.DrawerListener() {
    @Override public void onDrawerSlide(View drawerView, float slideOffset) {}
    @Override public void onDrawerOpened(View drawerView) {}
    @Override public void onDrawerStateChanged(int newState) {}
    @Override
    public void onDrawerClosed(View drawerView) {
      if (mFragmentToSet != null) {
        getSupportFragmentManager()
              .beginTransaction()
              .replace(R.id.container, mFragmentToSet)
              .commit();
        mFragmentToSet = null;
      }
    }
});
One more not-so-obvious point: starting with Android 3.0, app UI rendering is handled by the GPU. This means bitmaps, drawables, and resources defined in the app’s theme are uploaded to GPU memory, so access to them is very fast.
Any UI element shown on the screen is converted into a set of polygons and GPU commands, so it renders quickly—for example, during scrolling. Likewise, a View will hide and show just as quickly by toggling its visibility property (button.setVisibility(View.GONE) and button.setVisibility(View.VISIBLE)).
But when a View changes—even in the smallest way—the system has to recreate it from scratch, uploading new geometry and draw commands to the GPU. Changes to a TextView are even more expensive, because Android must first rasterize the font (turn the text into a set of bitmap rectangles), then perform all measurements and generate GPU commands. There’s also the cost of recomputing the position of the current element and other elements in the layout. Keep all of this in mind and change Views only when it’s truly necessary.
Overdraw is another serious problem. As we noted above, rendering complex layouts with lots of nested elements is slow in itself, and it will almost inevitably lead to frequent screen redraws.
Imagine you have several nested LinearLayouts, and some of them also have a background set. That means they not only contain other UI elements but also draw a bitmap or a solid color behind them. During rendering, the GPU will do the following: it fills the area of the root LinearLayout with the appropriate color, then fills the area of the nested layout with another color (or the same one), and so on. As a result, many pixels on the screen get drawn multiple times within a single frame. That’s wasted work with no benefit.
You can’t completely eliminate overdraw. For example, if you need to display a button on a red background, you still have to fill the screen with red first and then overwrite the pixels where the button appears. Android can optimize rendering to prevent overdraw in some cases (for instance, if two same‑size elements overlap and the top one is opaque, the bottom one simply won’t be drawn). Still, much depends on the developer, who should make every effort to minimize overdraw.
The GPU overdraw debugging tool will help with this. It’s built into Android and can be found at: Settings → Developer Options → Debug GPU overdraw → Show overdraw areas. Once enabled, the screen will be tinted in different colors, which indicate the following:
- default color — single overlap;
- blue — double overlap;
- green — triple overlap;
- red — quadruple overlap or more.
The rule of thumb is simple: if most of your app’s interface has turned green or red, you’ve got a problem. If you mostly see blue (or your app’s primary/brand color) with small accents of green and red where toggles or other dynamic UI elements appear, you’re fine.
 |
 |
| Overdraw in a well‑optimized app vs. in a poorly optimized one | |
And here are a few tips:
- Try to avoid using the background attribute on layouts.
- Reduce the number of nested layouts.
- At the beginning of your Activity code, add: getWindow().setBackgroundDrawable(null);
- Avoid transparency where you can do without it.
- Use the Hierarchy Viewer tool (https://developer.android.com/studio/profile/hierarchy-viewer.html) to analyze your layout hierarchy, their relationships, rendering performance, and sizing/measure calculations.
Systrace
In a relatively simple app you built in a few days, finding bottlenecks isn’t hard—just follow the guidelines above. But once you’re dealing with a truly large project, you’ll need dedicated tools.
Systrace is one of the most important tools you should master. It’s a tracing tool that lets you see what’s happening on the device while your app is running. In particular, it clearly shows how each frame is rendered, which frames were drawn on time, and which ones the system had to drop.
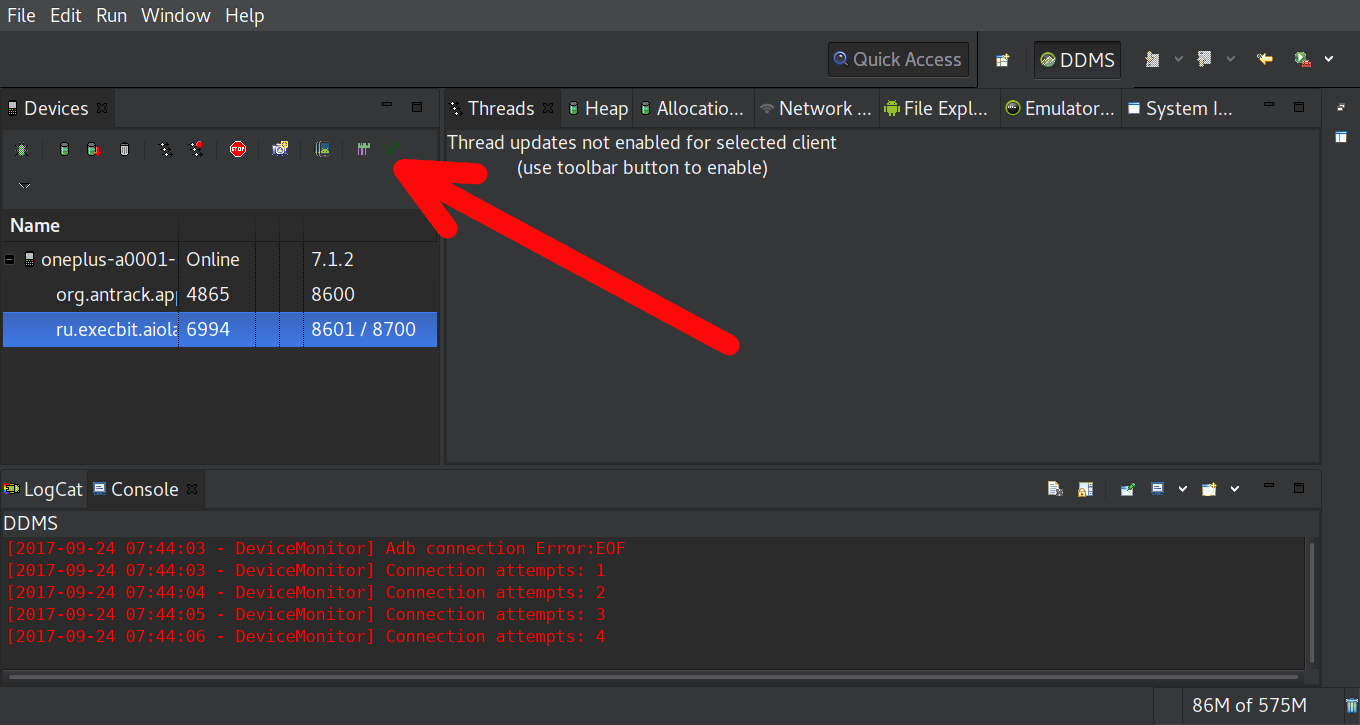
You can launch Systrace via the Android Device Monitor, which you’ll find under Tools → Android in Android Studio. Open Android Device Monitor, wait for it to detect your device, select your app, and click the Start Tracing button.
In the launch window that opens, leave all settings as-is and click OK. Tracing will run for five seconds, after which an HTML file with the data will be generated (on *nix, that’s the trace.html file in your home directory). Open it in a browser.

At first glance, a Systrace report can be bewildering—there’s a ton of data that doesn’t seem to mean much. Fortunately, you won’t need most of it; focus on the Frames, UI Thread, and RenderThread rows.
The Frames track shows screen updates. Each frame is represented by a dot in one of three colors: green, yellow, or red. Green means the frame was rendered within 16.6 ms; yellow and red indicate it took longer than 16.6 ms, meaning the frame rate is dropping. Directly below the Frames row is the UI Thread row, which lets you analyze the steps the system took to render the frame.
Click the circle to see why the system took longer than expected to render a frame. Possible causes and fixes are covered in the developer documentation. I’ll just add that you can usually ignore the “Scheduling delay” issue: it’s often caused by Android itself rather than your app, and it shows up most on older or low‑end devices.
Systrace lets you pinpoint at which stage a frame got delayed. But it won’t tell you whether the issue was caused by your code—and if so, where the bottleneck is. To track it down, you can enrich the Systrace output by adding trace markers to your app, so you can see how long your own code paths take. Example: tracing the onBindViewHolder method:
@Override
public void onBindViewHolder(MyViewHolder holder, int position) {
    Trace.beginSection("MyAdapter.onBindViewHolder");
    try {
        try {
            Trace.beginSection("MyAdapter.queryDatabase");
            RowItem rowItem = queryDatabase(position);
            mDataset.add(rowItem);
        } finally {
            Trace.endSection();
        }
        holder.bind(mDataset.get(position));
    } finally {
        Trace.endSection();
    }
}
Android has a simpler built-in profiling tool. Just enable Developer options → Profile GPU rendering → On screen as bars, and a chart will appear on the screen. The X-axis shows frames; the Y-axis shows bars representing how long each frame took to render. If a bar is above the green line, that frame took more than 16.6 ms to render.
Android Profiler
This is another important tracing tool that lets you measure how long each method in your app takes to complete. Like Systrace, it generates a report for a specified time window, but this report is much lower-level and covers every individual method that was invoked.
Launch Android Studio, click Android Profiler at the bottom of the screen, then select CPU and press the red circular Record button at the top. Stop the recording when needed. A report pane will appear at the bottom.

By default, the report is displayed as a chart with time on the X-axis and invoked methods on the Y-axis. System methods (APIs) are shown in orange, the application’s own methods in green, and third-party APIs, including Java, in blue. The Flame chart tab shows a similar view where identical methods are aggregated. It’s useful because it lets you quickly gauge how much total time each method ran over the entire tracing period.
The Top Down and Bottom Up tabs display the method call tree, including how much time each method took to execute:
- Self — time spent executing the method’s own code
- Children — time spent executing all methods it calls
- Total — the sum of Self and Children
Like Systrace, this tool requires careful analysis of its report. It won’t point out where things went wrong. It simply shows what happened and when in your app, and helps you identify the parts of the code that consumed the most CPU time.
Conclusions
I’ve only covered a small slice of what’s worth considering when building a high-performance app. You’ll run into countless situations and issues along the way. No article or book can teach you how to handle them—only hands-on experience and a solid understanding of how Android works will.