Typically, collecting statistics requires deploying something large and cumbersome, like Zabbix, Nagios, or Icinga. These tools also need databases, constant public access with a white IP, and computing resources that could be used for other purposes. Maintaining such products can also turn out to be quite costly.
What if you need just monitoring without enterprise-level solutions, but still want extensive capabilities? Ideally, you wouldn’t want to deal with maintenance, migrations, updates, hardware replacements, or other resource-intensive tasks. To address this specific practical need, there’s the Netdata agent. I’ll try to explain the capabilities of Netdata and the features I use in my projects. In this article, we’ll go through the installation of the Netdata agent using Rocky Linux as an example.
About Netdata
Netdata is an agent designed to be deployed on physical and virtual servers, in containers, and on IoT devices. It works on Linux, FreeBSD, macOS, Kubernetes, Docker, LXC, LXD, Xen, and more.
The Netdata agent monitors a wide range of system metrics, and its functionality can be expanded with ready-made plugins. There’s a well-developed guide on how to write your own custom extensions. While Python was previously the preferred language for creating plugins, developers are now transitioning to Go (Golang). Python support remains intact, and the agent can also handle plugins written in Bash and Node.js.
Netdata utilizes procfs files for basic system monitoring. When the agent starts, plugins are launched to connect with service monitoring. The ports and monitoring methods are predefined in the default configuration. If the services required by the plugins are unavailable or missing, the plugins will simply stop running, but this will not cause Netdata to stop or crash, unlike telegraf, for instance. Resource consumption is minimal, which allows Netdata to run even on routers with OpenWRT.
Netdata supports out-of-the-box monitoring for an impressive list of services, including PostgreSQL, MySQL, Redis, RabbitMQ, MongoDB, OpenLDAP, SNMP, Apache, nginx, and others. It implements metric collection and aggregation down to a one-second resolution and comes with predefined event triggers for alerts in /. The agent collects resource usage statistics by users and services (CPU, IO, RAM, network) using apps.plugin. By default, the list includes the most common services, grouped by categories, and can be extended. It also supports trigger-based alerts through several tools:
- alerta.io;
- Amazon Simple Notification Service;
- Discord;
- Dynatrace;
- Email;
- Flock;
- Google Hangouts;
- IRC;
- Kavenegar;
- Matrix;
- MessageBird;
- Microsoft Teams;
- Opsgenie;
- PagerDuty;
- Prowl;
- PushBullet;
- PushOver;
- Rocket.Chat;
- Slack;
- SMS Server Tools 3;
- StackPulse;
- Syslog;
- Telegram;
- Twilio;
- Dashboard (HTML notifications when a Netdata agent tab is open in the browser).
Additionally, there is an option to collect and aggregate data in Netdata Cloud, which provides a dedicated web interface for accessing statistical data. Furthermore, Netdata Cloud does not have the following limitations:
- Data Retention Policy;
- Number of users in the organization;
- Number of nodes, containers, and hosts;
- Number of administrators;
- Notifications (via email, webhooks).
Of course, with a service provided under a free model, there are no guarantees of availability. However, the developers themselves claim: “Netdata Cloud commits to providing users with free and unlimited monitoring forever.”
Preparing for Netdata Installation
In this article, we will use a virtual machine with the IP address 172.16.210.134. To ensure you, dear reader, do not encounter any issues while exploring Netdata with SELinux set to enforcing mode, I suggest disabling it. Let’s start by updating the system:
$ sudo yum update -y
Let’s check the current status of SELinux:
[
SELinux status: enabled
SELinuxfs mount: /sys/fs/selinux
SELinux root directory: /etc/selinux
Loaded policy name: targeted
Current mode: enforcing
Mode from config file: enforcing
Policy MLS status: enabled
Policy deny_unknown status: allowed
Memory protection checking: actual (secure)
Max kernel policy version: 33
Now, let’s disable SELinux and restart the system:
[
[
SELinux status: enabled
SELinuxfs mount: /sys/fs/selinux
SELinux root directory: /etc/selinux
Loaded policy name: targeted
Current mode: permissive
Mode from config file: enforcing
Policy MLS status: enabled
Policy deny_unknown status: allowed
Memory protection checking: actual (secure)
Max kernel policy version: 33
[[
Finally, let’s check the status of SELinux after the reboot:
[
Disabled[
SELinux status: disabled
Installing Netdata
The developers of Netdata offer several methods for installing the agent:
- Script kickstart.sh
- Script packagecloud.io for connecting to the Netdata repository
We will use the second method — a script to connect to the repository. Based on experience with administering binary distributions, I recommend installing packages from repositories, since cleaning up after custom scripts can be quite a hassle. The script will connect our Rocky Linux to the required .rpm repository, after which you’ll just need to manually install the Netdata package.
info
By default, Netdata collects anonymous usage data and sends statistics to Netdata’s servers via PostHog. PostHog is an open-source product analytics platform. The anonymous data is collected from two sources within Netdata:
- the dashboards (web GUI);
- the backend agent.
The collected data includes:
- Netdata version;
- operating system and OS version;
- kernel, kernel version, and architecture;
- virtualization technology;
- containerization technology.
The statistics also include crash and error reports.
The developers of Netdata claim that usage statistics of the agent are crucial for them, as this data is necessary for detecting errors and planning new features, essentially improving the product. It’s up to you to decide whether or not to disable this functionality, as it does not carry any harmful features. You can disable the collection and transmission of statistics in any of the following three ways:
- Create a
.file inopt-out-from-anonymous-statistics /before starting.etc/ netdata/ - When installing Netdata, specify the
--disable-telemetryoption in the script (not applicable in our case). - Set the environment variable
DO_NOT_TRACK=1(for example, when deploying a Docker container).
Let’s begin the installation of Netdata:
# Connecting the epel repository$ sudo yum install epel-release -y# Downloading the script to add the Netdata repository$ curl -s https://packagecloud.io/install/repositories/netdata/netdata/script.rpm.sh | sudo bash
# Installing Netdata$ sudo yum install netdata -y
To access the current Netdata configuration file, start the agent and execute the following command (be aware that the configuration is extensive and is meant only for familiarization with the main options):
$ curl -o ~/netdata.conf http://localhost:19999/netdata.conf
When manually editing the Netdata configuration, developers recommend using the wrapper script edit-config:
# Navigate to the Netdata configuration directory$ cd /etc/netdata/
# Hint: replace sample.conf with the required file from /usr/lib/netdata/conf.d/$ sudo ./edit-config <sample.conf>
Configuring Netdata
The primary configuration file is named /, and with the minimum required parameters, it looks like this:
[global] run as user = netdata # The default database size — 1 hour history = 3600 # Some defaults to run Netdata with least priority process scheduling policy = idle OOM score = 1000[web] web files owner = root web files group = netdata # By default do not expose the Netdata port bind to = localhostLet’s make a few changes:
[global] OOM score = -900 run as user = netdata enable zero metrics = yes # Some defaults to run Netdata with least priority process scheduling policy = idle # Database size — 20 min history = 1200[web] # By default do not expose the Netdata port bind to = localhost web files owner = root web files group = netdata[health] enabled = yes[host labels] type = virt location = xakep instance = netdataThe OOM parameter specifies the value for /, which, based on various factors, determines the priority of a process for being “killed” by the oom_killer. By default, Netdata has an OOM of 1000, making it one of the first candidates for termination. However, since we need server resource statistics to identify the resource hogs, the Netdata agent should only be terminated as a last resort.
To check the oom-score, you might use the choom utility. However, in Rocky Linux, as well as in CentOS and Red Hat, util-linux is provided at version 2.32, while choom is available starting from util-linux version 2.33 (Util-linux 2.33 Release Notes dated November 1, 2018). Despite the fact that the author of choom is an employee at Red Hat, the OS and its derivative distributions (except Fedora) still use util-linux-2..
Let’s not dwell on the negatives; instead, let’s demonstrate how choom operates and the effect of the OOM parameter with util-linux-2. using a Fedora example. When OOM :
[
pid 15731’s current OOM score: 1334
pid 15731’s current OOM score adjust value: 1000
With OOM :
[
pid 17958’s current OOM score: 667
pid 17958’s current OOM score adjust value: 0
Now, let’s quickly go over the parameters:
-
bind: I’ll keep this setting as is, because I don’t plan to access the dashboard directly or via the network, nor expose it behind nginx, etc. For now, we simply need statistics on indicators and metrics over months and years.to -
enable: It’s useful to enable this, as it allows us to track the presence of metrics even if they have zero values.zero metrics -
history: I’m reducing the local Netdata database to minimal acceptable values to conserve resources. The database uses both disk and RAM. In our case, metrics statistics will be reduced to 20 minutes. You can use a resource calculator for different database values on this site. -
host: This parameter is used to specify custom global tags, which is convenient for grouping hosts and systems into categories. I recommend reading the guidelines and limitations on specifyinglabels host. Tags likelabels type,location, andinstance, and their values, are customizable; you don’t have to stick to these and can create your own. -
memory(Kernel Same Page Merging): I’m not enabling KSM since our use case doesn’t require it. To enable KSM in Netdata, KSM must first be activated in Linux. By default, KSM isn’t used in Red Hat, Rocky, CentOS, but if needed, you should first analyze resource usage statistics over a long period before enabling KSM, then observe resource use with KSM enabled. In multi-CPU systems, RAM savings may be slight, while processor load could increase noticeably. KSM performance depends on the system’s workload, as enabling KSM will require additional operations for memory page allocation due to the copy-on-write mechanism.deduplication ( ksm)
I will not provide recommendations for configuring iptables and nginx for access organization, since our host will be connecting to Netdata Cloud. To access the Netdata dashboard on a physical or virtual host, you can set up an SSH tunnel. In the example below, the address of a virtual host (172.16.210.134) running the Netdata agent is used. To create the tunnel, execute the following command:
$ ssh -NL 19999:127.0.0.1:19999 xakep@172.16.210.134
To access the Netdata dashboard of a virtual host, navigate to http:// in your browser after setting up the tunnel.
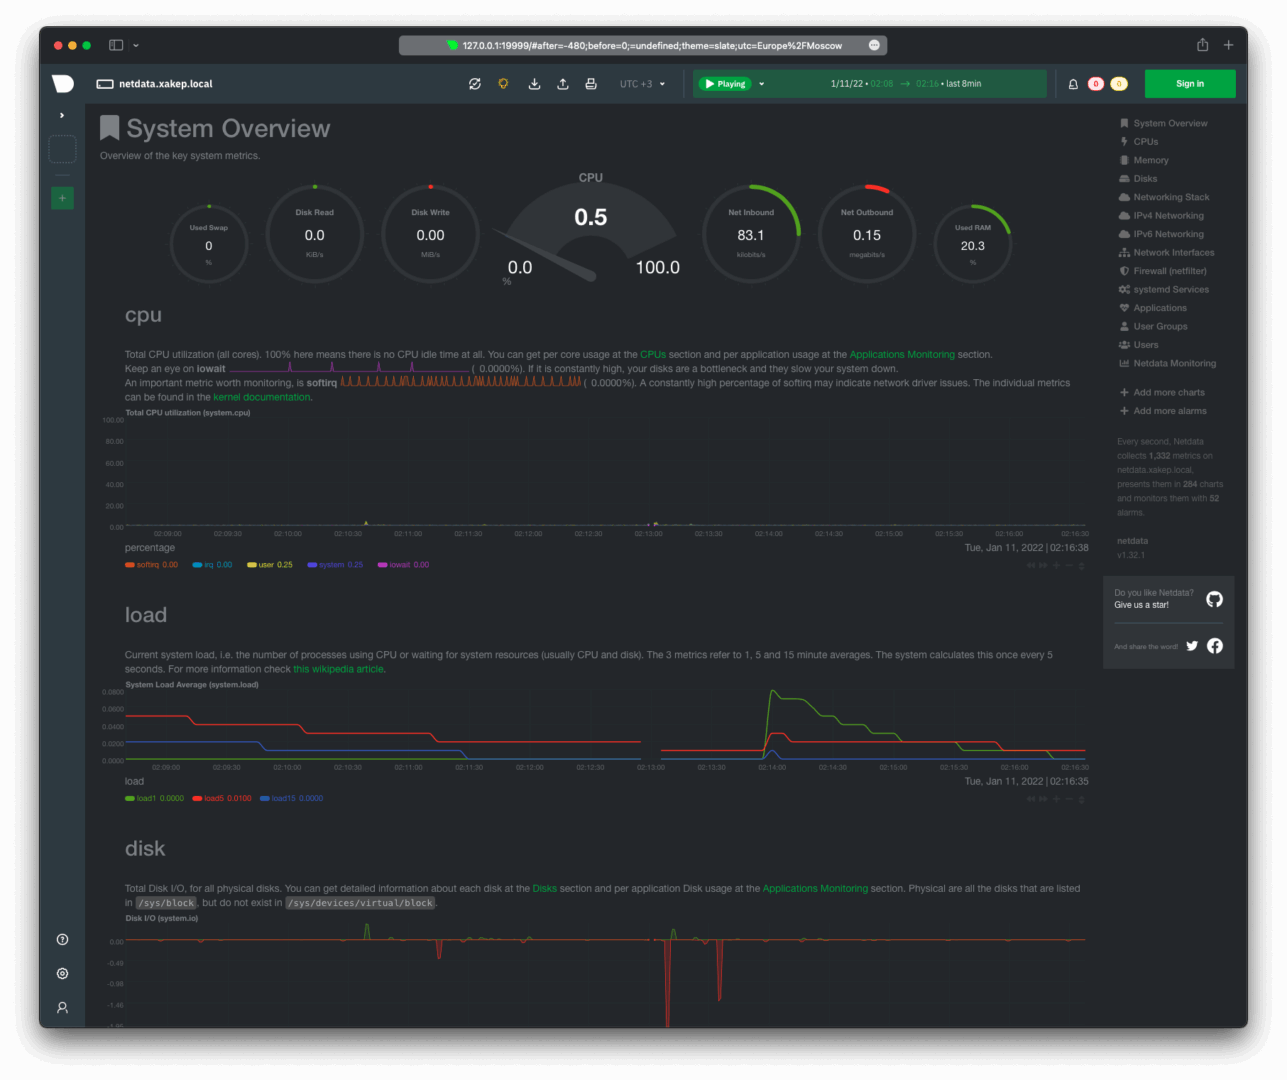
To set up centralized access to statistics with a single dashboard for all hosts, there are several approaches:
- Set up one of the supported TSDB (TimeSeries Database) as a backend for Netdata.
- Configure Netdata agents for streaming, which involves setting up a parent Netdata instance and child instances.
- Connect the agent to Netdata Cloud.
Connecting to Netdata Cloud
Netdata Cloud offers unlimited resources such as CPU, memory, disk, and network. Our task is to set up a virtual machine with the Netdata agent. The goal is to receive notifications about failures and issues on hosts with minimal time, financial costs, and minimal overhead for maintaining the monitoring system. Since network provider issues or Netdata agent downtime can prevent notifications from reaching us, an external dashboard with constant network access is necessary.
The Netdata Agent connects to Netdata Cloud using a simple script. Once executed, private and public keys will be generated in the / directory, along with a configuration file and a token file for connectivity. You can obtain the script with the necessary tokens after registering in the Netdata Cloud admin panel—only an email address is required for this.
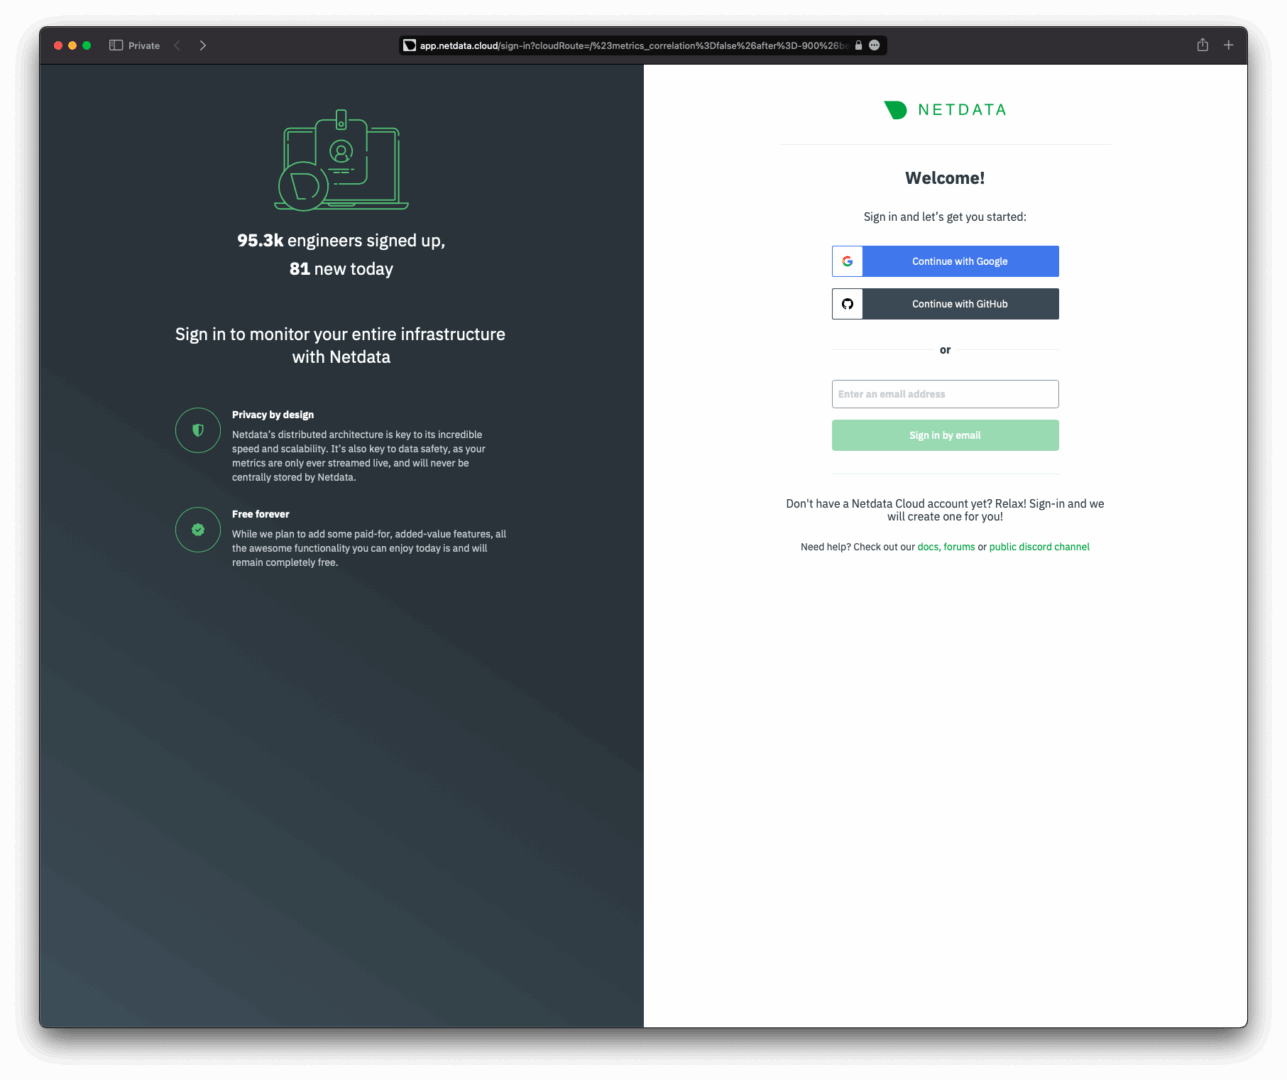
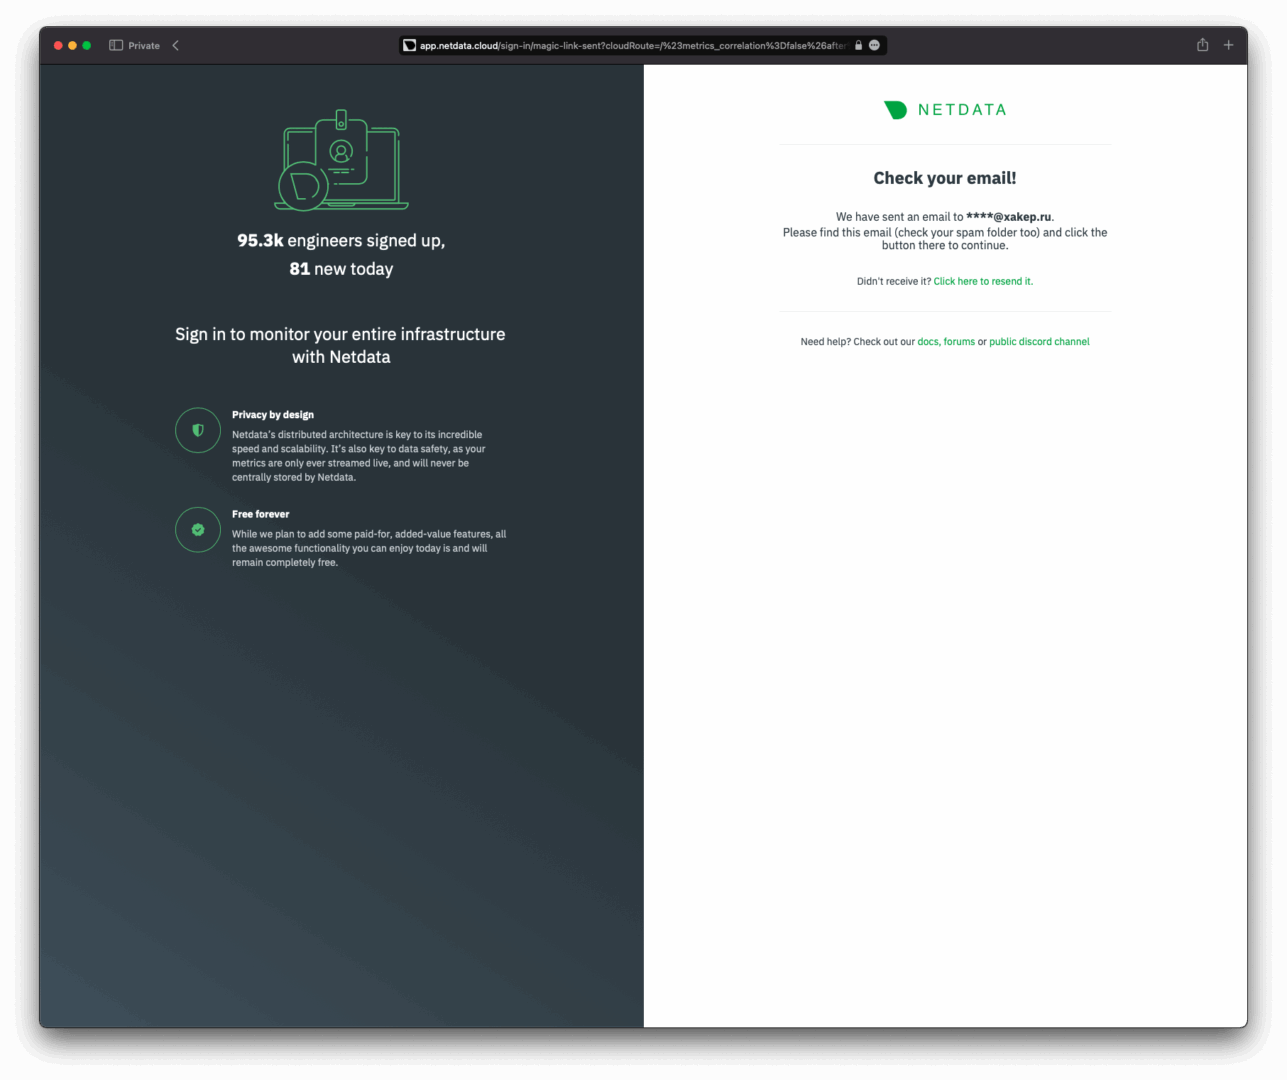
Enter your email and receive a link to access your newly created organization as an administrator. Within this organization, you can add users, create spaces, manage group access, build dashboards, and more.
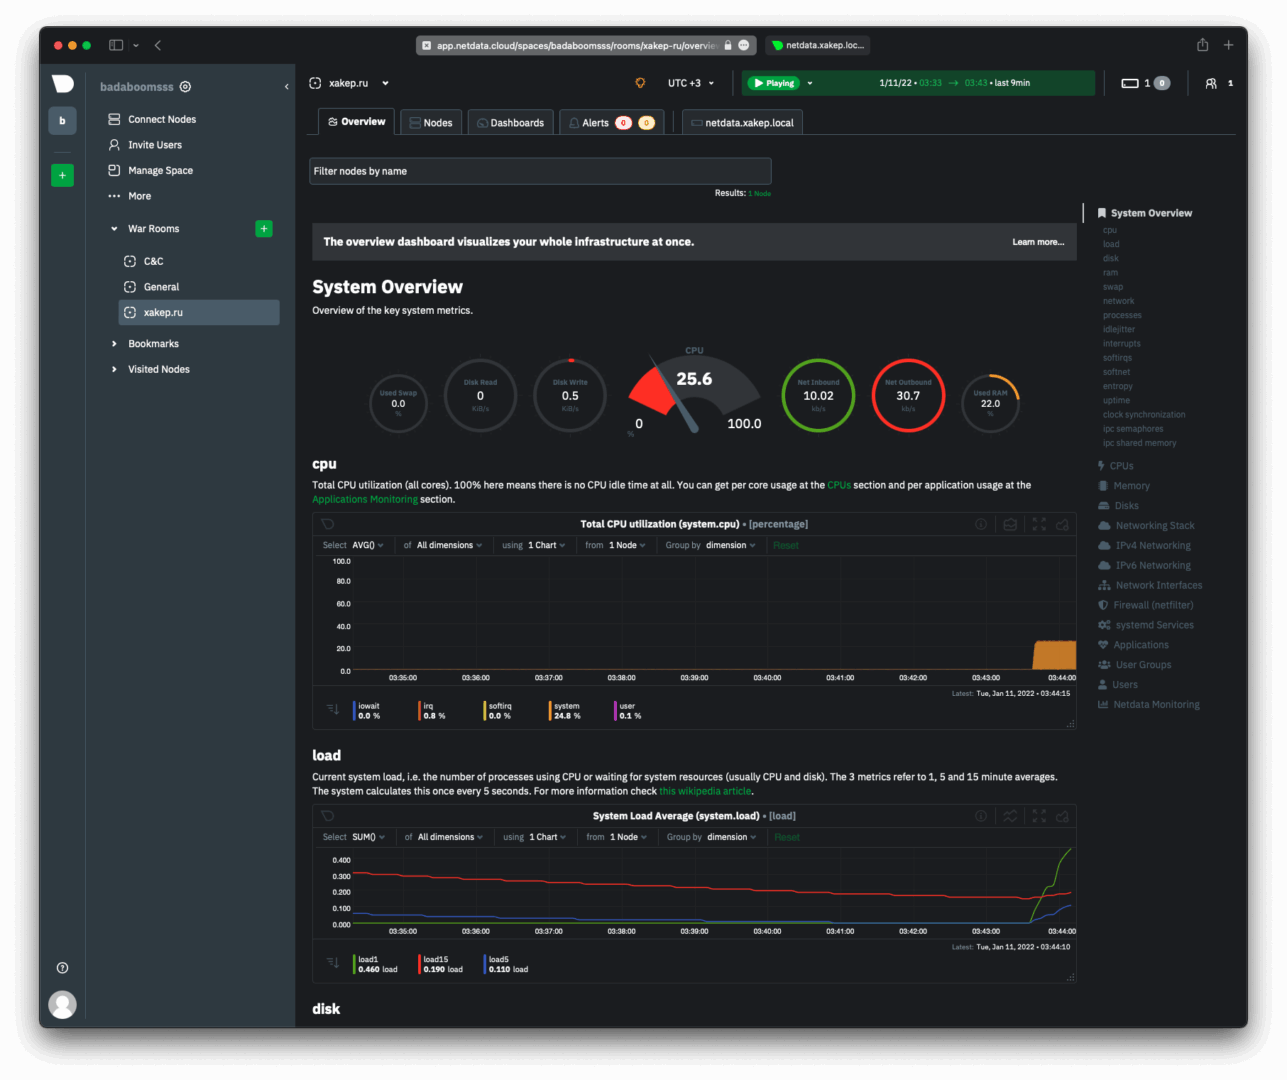
You can find the script to connect a virtual host to Netdata Cloud by navigating to the WarRooms section and selecting General or any specific room. I created a room called xakep.ru to which I will connect the virtual host.
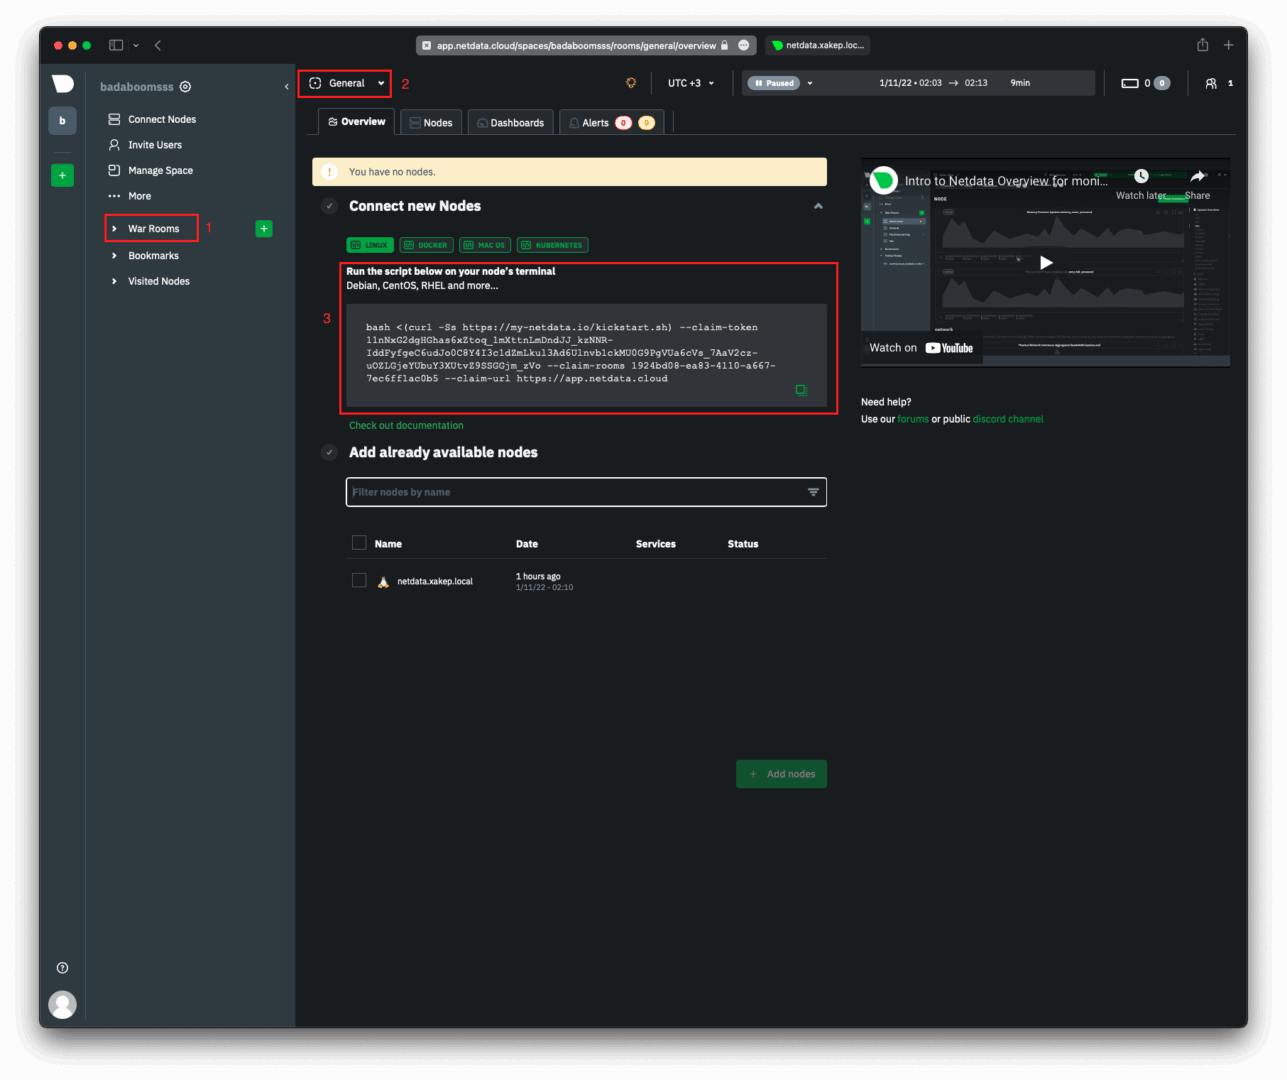
The section marked as number 3 in the screenshot above is the script used to connect the host. You need to execute this script on the host where you’ve installed the Netdata agent. In my case, this is a virtual machine with the IP address 172..
[
— Found existing install of Netdata under: / —
— Existing install appears to be handled manually or through the system package manager. —
— Attempting to claim agent to https://app.netdata.cloud —
Token: ****************
Base URL: https://app.netdata.cloud
Id: 7e48a49e-7218-11ec-b69f-000c294a3927
Rooms: 341e4fe1-14fb-4181-ad5a-445b157e80fe
Hostname: netdata.xakep.local
Proxy:
Netdata user: netdata
Generating private/public key for the first time.
Generating RSA private key, 2048 bit long modulus (2 primes)
…………………+++++
………………………………………………………………………………+++++
e is 65537 (0x010001)
Extracting public key from private key.
writing RSA key
Connection attempt 1 successful
Node was successfully claimed.
— Successfully claimed node —
Here it is — a successful connection of a virtual machine to Netdata Cloud, showing its metrics.
Plugins
Netdata is transitioning its plugins from Python to Golang, organizing them into a separate repository. The integration of Golang plugins into Netdata (current list and configurations of Golang plugins) is structured as follows:
# Navigate to the directory with Netdata configs$ cd /etc/netdata/
# Enable the necessary plugins using the wrapper script$ sudo ./edit-config go.d.conf
Even if the go. file is not present in the / directory, you can use the edit-config script to edit the configurations. This script will create the file by copying it from / and open it for editing. This command is sufficient for a basic activation of the plugin, but in some cases, the plugin may require additional configuration in the / file. This method is also applicable to plugins written in Python, with the adjustment that go. should be changed to python..
For example, let’s install pdns-recursor and enable its statistics. Pdns-recursor is a recursive DNS server that was previously separated into a standalone project from the unified powerdns solution. The installation is done with the following command:
$ sudo yum install pdns-recursor -y
Now let’s configure powerdns-recursor to provide statistics. The plugin documentation and the PowerDNS documentation outline the necessary steps:
- Enabling the
webserverparameter inpowerdns-recursorto display statistics. - Activating the HTTP API by setting the
api-keyparameter to provide access to statistics.
info
You can copy and use the commands from this demo—and the ones that follow—directly from the player; it’s just text. But be careful: extra characters might slip into your clipboard.
Here is a video tutorial on configuring powerdns-recursor.
Here’s the procedure for creating and editing the go. configuration file and enabling the Go plugin powerdns_recursor.
To apply the changes, you need to restart Netdata:
$ sudo systemctl restart netdata.service
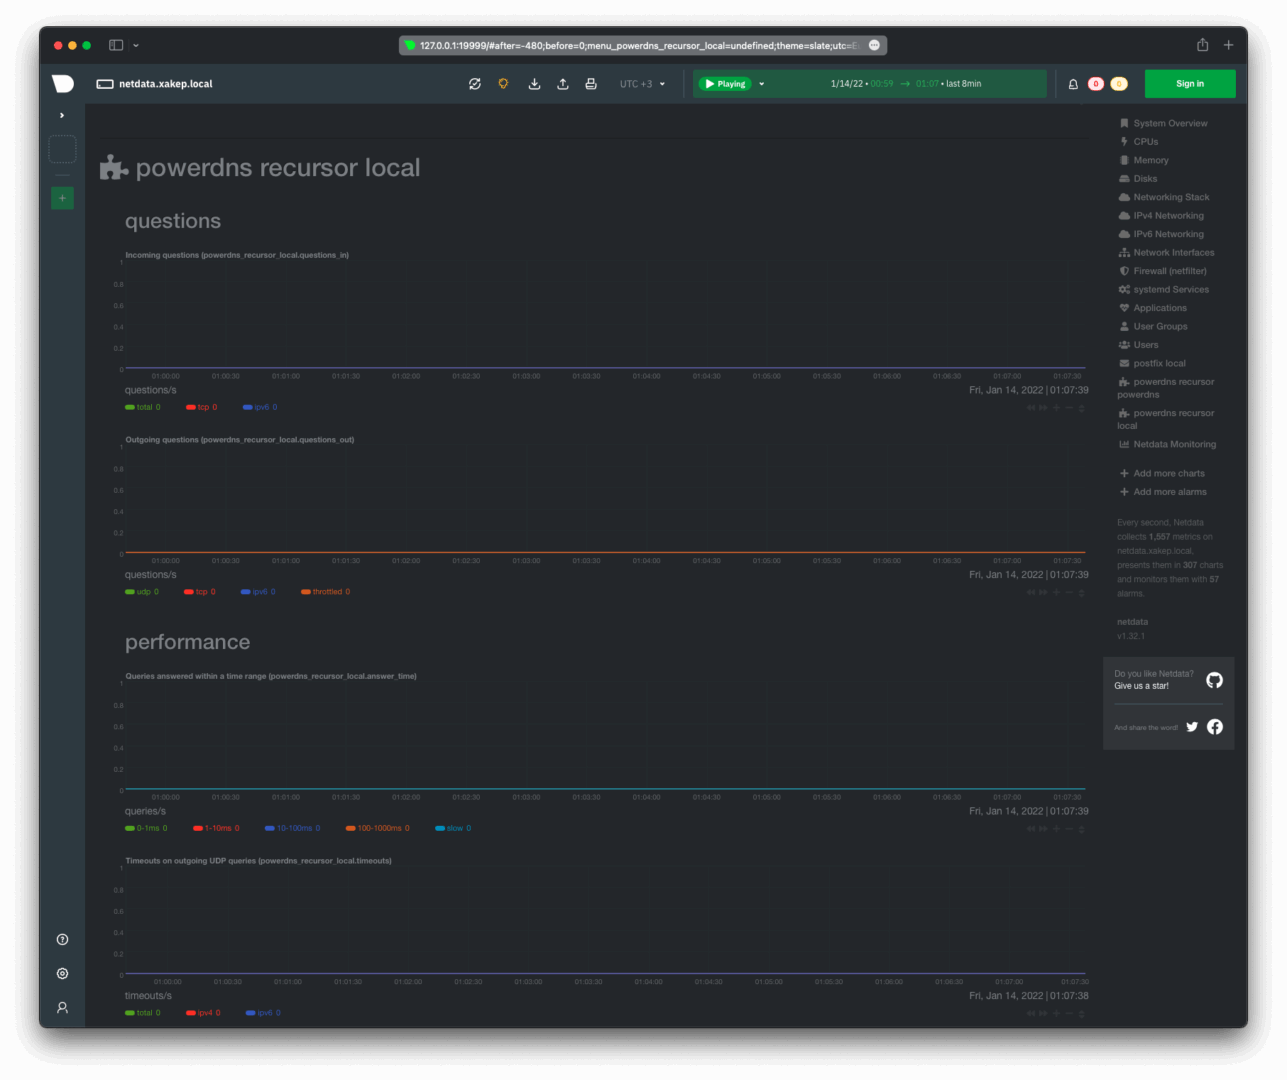
An observant reader might have noticed in the screenshot above that the powerdns section in the right column has appeared twice. One entry, labeled job-a, pertains to powerdns, and the other to local. We were configuring local. It’s necessary to check the Netdata logs (/):
[
2022-01-12 19:36:36: go.d INFO: main[main] looking for ‘powerdns.conf’ in [/etc/netdata/go.d /usr/lib/netdata/conf.d/go.d]
2022-01-12 19:36:36: go.d INFO: main[main] found ‘/usr/lib/netdata/conf.d/go.d/powerdns.conf
2022-01-12 19:36:36: go.d INFO: main[main] looking for ‘powerdns_recursor.conf’ in [/etc/netdata/go.d /usr/lib/netdata/conf.d/go.d]
2022-01-12 19:36:36: go.d INFO: main[main] found ‘/etc/netdata/go.d/powerdns_recursor.conf
2022-01-12 19:36:36: go.d ERROR: prometheus[powerdns_exporter_local] Get “http://127.0.0.1:9120/metrics”: dial tcp 127.0.0.1:9120: connect: connection refused
2022-01-12 19:36:36: go.d ERROR: prometheus[powerdns_exporter_local] check failed
2022-01-12 19:36:36: go.d ERROR: powerdns[local] ‘http://127.0.0.1:8081/api/v1/servers/localhost/statistics’ returned HTTP status code: 401
2022-01-12 19:36:36: go.d ERROR: powerdns[local] check failed
2022-01-12 19:36:36: python.d INFO: plugin[main] : [powerdns] built 1 job(s) configs
2022-01-12 19:36:36: python.d INFO: plugin[main] : powerdns[powerdns] : check failed
2022-01-12 19:36:59: go.d ERROR: powerdns_recursor[local] ‘http://127.0.0.1:8081/api/v1/servers/localhost/statistics’ returned HTTP status code: 401
2022-01-12 19:36:59: go.d ERROR: powerdns_recursor[local] check failed
2022-01-12 19:52:26: go.d INFO: main[main] looking for ‘powerdns_recursor.conf’ in [/etc/netdata/go.d /usr/lib/netdata/conf.d/go.d]
2022-01-12 19:52:26: go.d INFO: main[main] found ‘/etc/netdata/go.d/powerdns_recursor.conf
2022-01-12 19:52:26: go.d INFO: main[main] looking for ‘powerdns.conf’ in [/etc/netdata/go.d /usr/lib/netdata/conf.d/go.d]
2022-01-12 19:52:26: go.d INFO: main[main] found ‘/usr/lib/netdata/conf.d/go.d/powerdns.conf
2022-01-12 19:52:26: python.d INFO: plugin[main] : [powerdns] built 1 job(s) configs
2022-01-12 19:52:26: python.d INFO: plugin[main] : powerdns[powerdns] : check success
2022-01-12 19:52:27: go.d ERROR: powerdns[local] returned metrics aren’t PowerDNS Authoritative Server metrics
2022-01-12 19:52:27: go.d ERROR: powerdns[local] check failed
2022-01-12 19:52:47: go.d ERROR: prometheus[powerdns_exporter_local] Get “http://127.0.0.1:9120/metrics”: dial tcp 127.0.0.1:9120: connect: connection refused
2022-01-12 19:52:47: go.d ERROR: prometheus[powerdns_exporter_local] check failed
2022-01-12 19:52:47: go.d INFO: powerdns_recursor[local] check success
2022-01-12 19:52:47: go.d INFO: powerdns_recursor[local] started, data collection interval 1s
From the log, we need these two lines:
2022-01-12 19:52:26: python.d INFO: plugin[main] : powerdns[powerdns] : check success
2022-01-12 19:52:47: go.d INFO: powerdns_recursor[local] check success
It is now clear that two plugins are involved—one in Python and the other in Go. We will disable the Python version of the plugin, keep the Go version, and then restart the agent.
In the Netdata log output, we are informed about the successful activation of the powerdns_recursor plugin written in Go, while the Python version of the plugin is not present.
2022-01-13 17:40:21: go.d INFO: powerdns_recursor[local] check success
2022-01-13 17:40:21: go.d INFO: powerdns_recursor[local] started, data collection interval 1s
Notifications (Alerts)
Currently, notifications in Netdata Cloud are sent only via email. Alerts through webhooks are expected in the future, but the timeline for this feature is unknown. If you need other notification methods, you can configure them on the host with the Netdata agent (in our case, on a virtual host).
Setting Up a Bot and Channel on Telegram
To receive notifications in Telegram, you can use a bot, but you must have an active account in the messenger. To get started, read the guide on creating a bot.
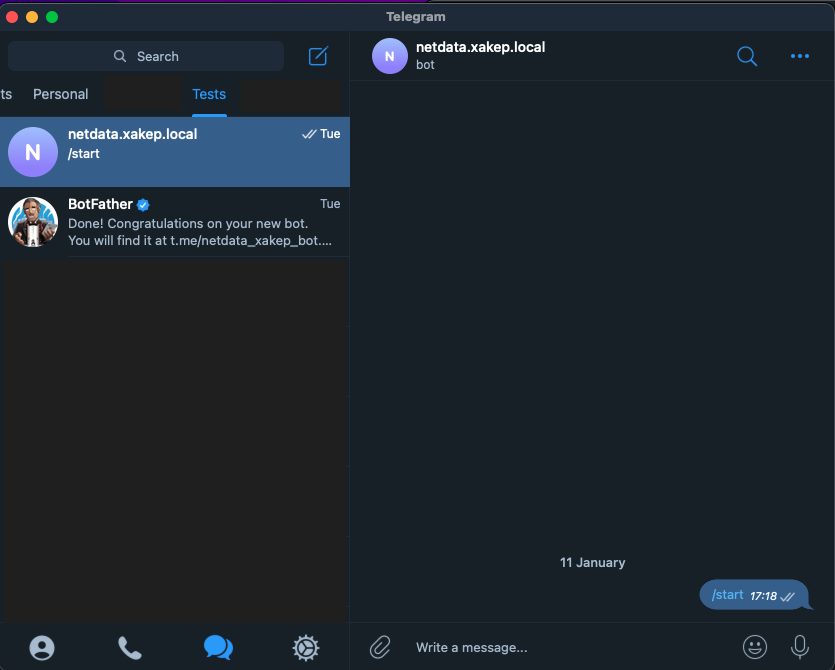
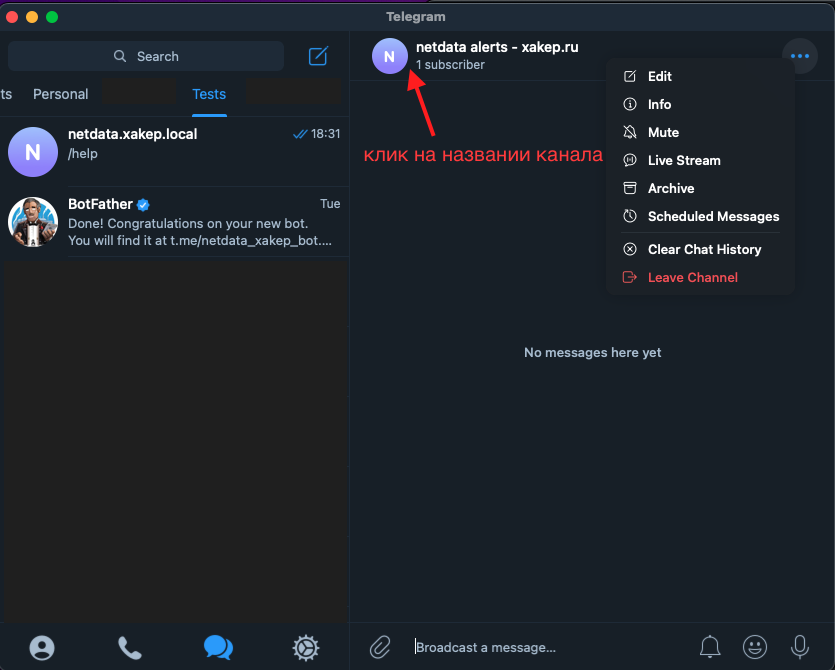
Create a channel where the bot can send Netdata alerts.

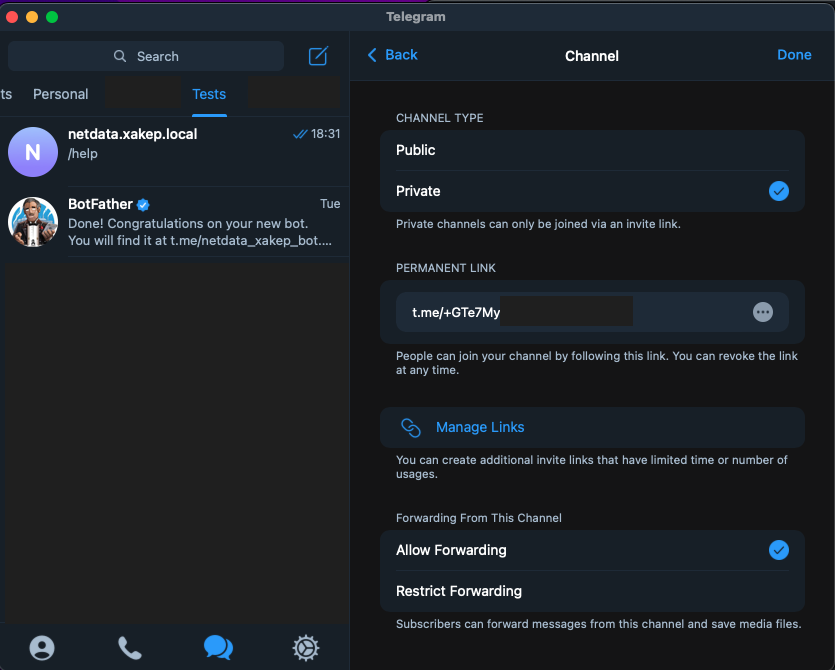
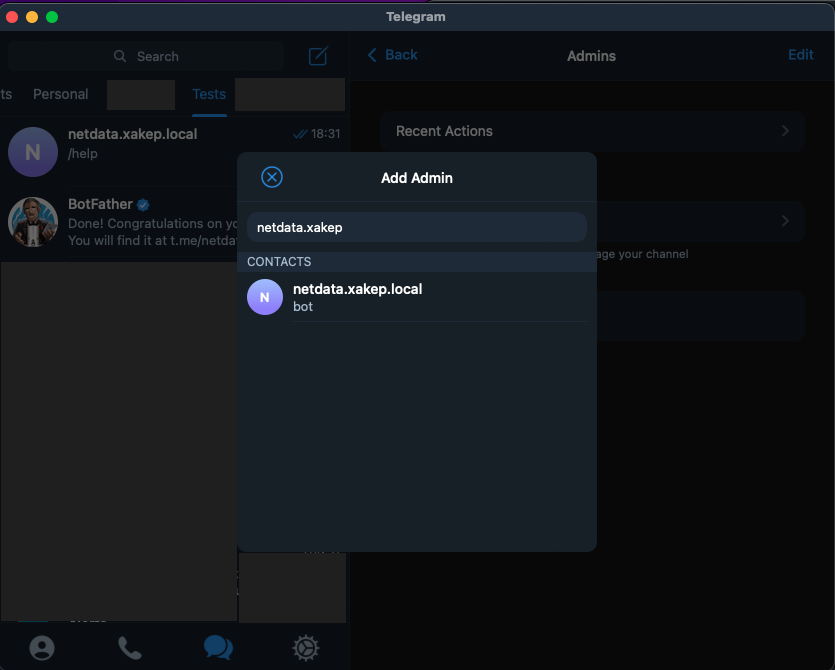
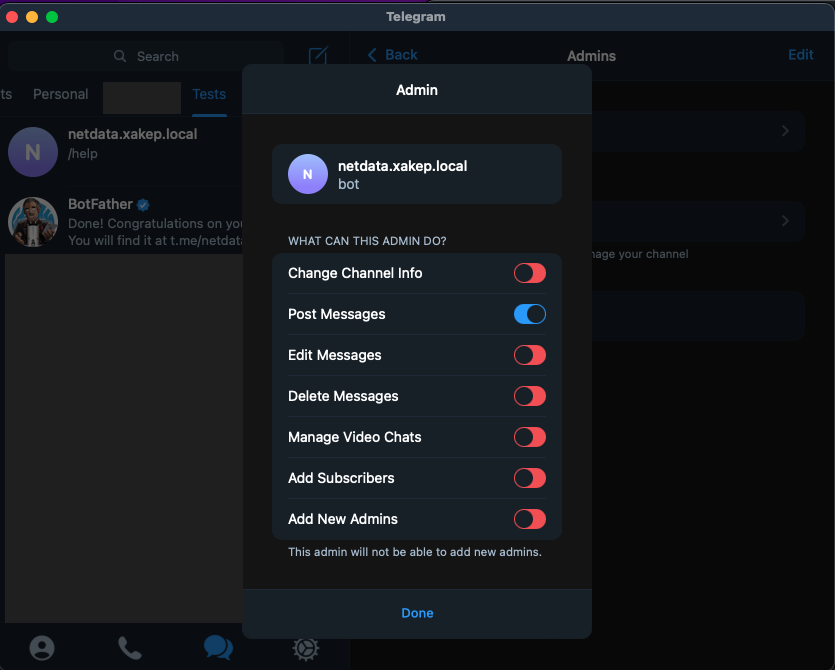
Now add the bot as an administrator to the channel you created, preferably restricting its permissions to only publish messages.
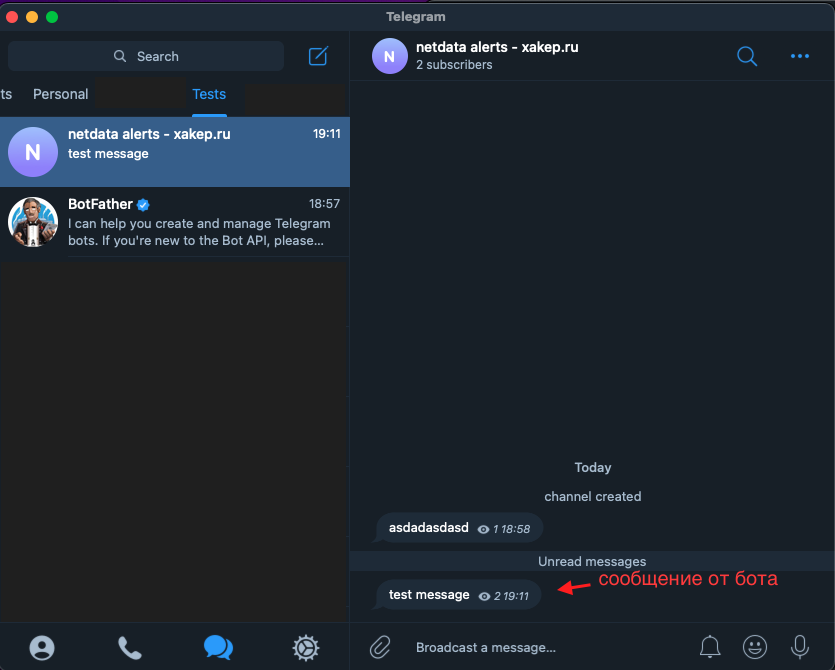
Send messages from your Telegram account to the newly created channel to activate it. This will help you find the channel ID in your bot’s properties. Then, retrieve the channel ID by accessing this link: https://. Replace XXX: with your bot’s token. You can obtain the token from @BotFather using its commands; the response will typically look like:
{ "ok":true, "result":[{ "update_id":976400277, "channel_post":{ "message_id":3, "sender_chat":{ "id":-1001513455910, "title":"netdata alerts - xakep.ru", "type":"channel" }, "chat":{ "id":-1001513455910, "title":"netdata alerts - xakep.ru", "type":"channel" }, "date":1642175925, "text":"test" } }]}You need the ID from sender_chat — -1001513455910. To send a test message that appears to be from your bot but is actually sent from the terminal, use api.:
curl -X POST "https://api.telegram.org/botXXX:YYYY/sendMessage" -d "chat_id=-zzzzzzzzzz&text=test message"
Configuring Netdata Alerts for Telegram
Here’s how to configure Netdata to send notifications to Telegram.
To verify whether notifications are being delivered to the correct Telegram channel, use the following script:
# Switching the current user xakep to netdata$ sudo su -s /bin/bash netdata
# Enabling debug output in the terminal$ export NETDATA_ALARM_NOTIFY_DEBUG=1
# Sending a test notification to the sysadmin group$ /usr/libexec/netdata/plugins.d/alarm-notify.sh test
As a result of the inspection, we will see that notifications in the specified Telegram channel have been successfully received.
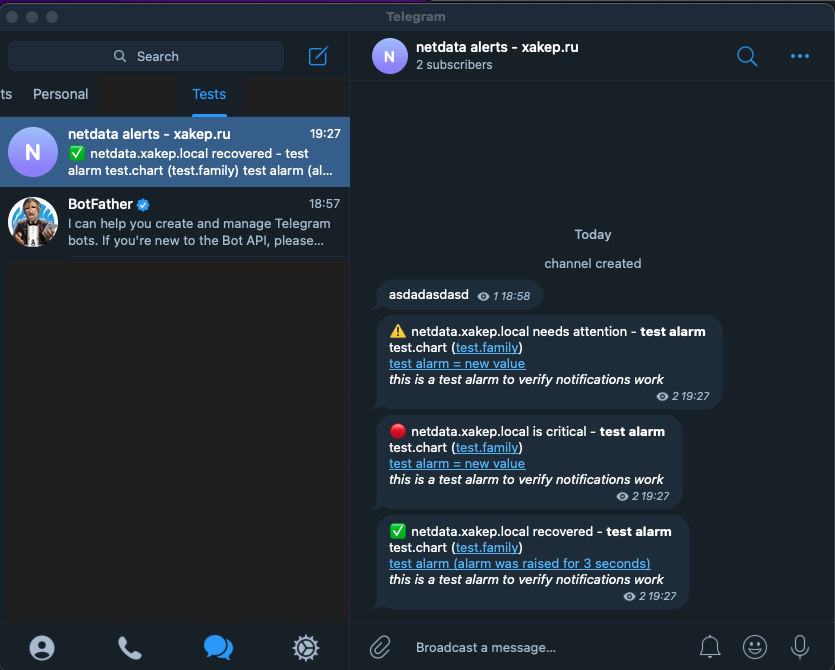
Checking Event Notifications in Netdata
You can check the available events for which you can receive notifications through the Netdata agent’s web interface at 127.. This uses port 19999, for which we have already set up an SSH tunnel.
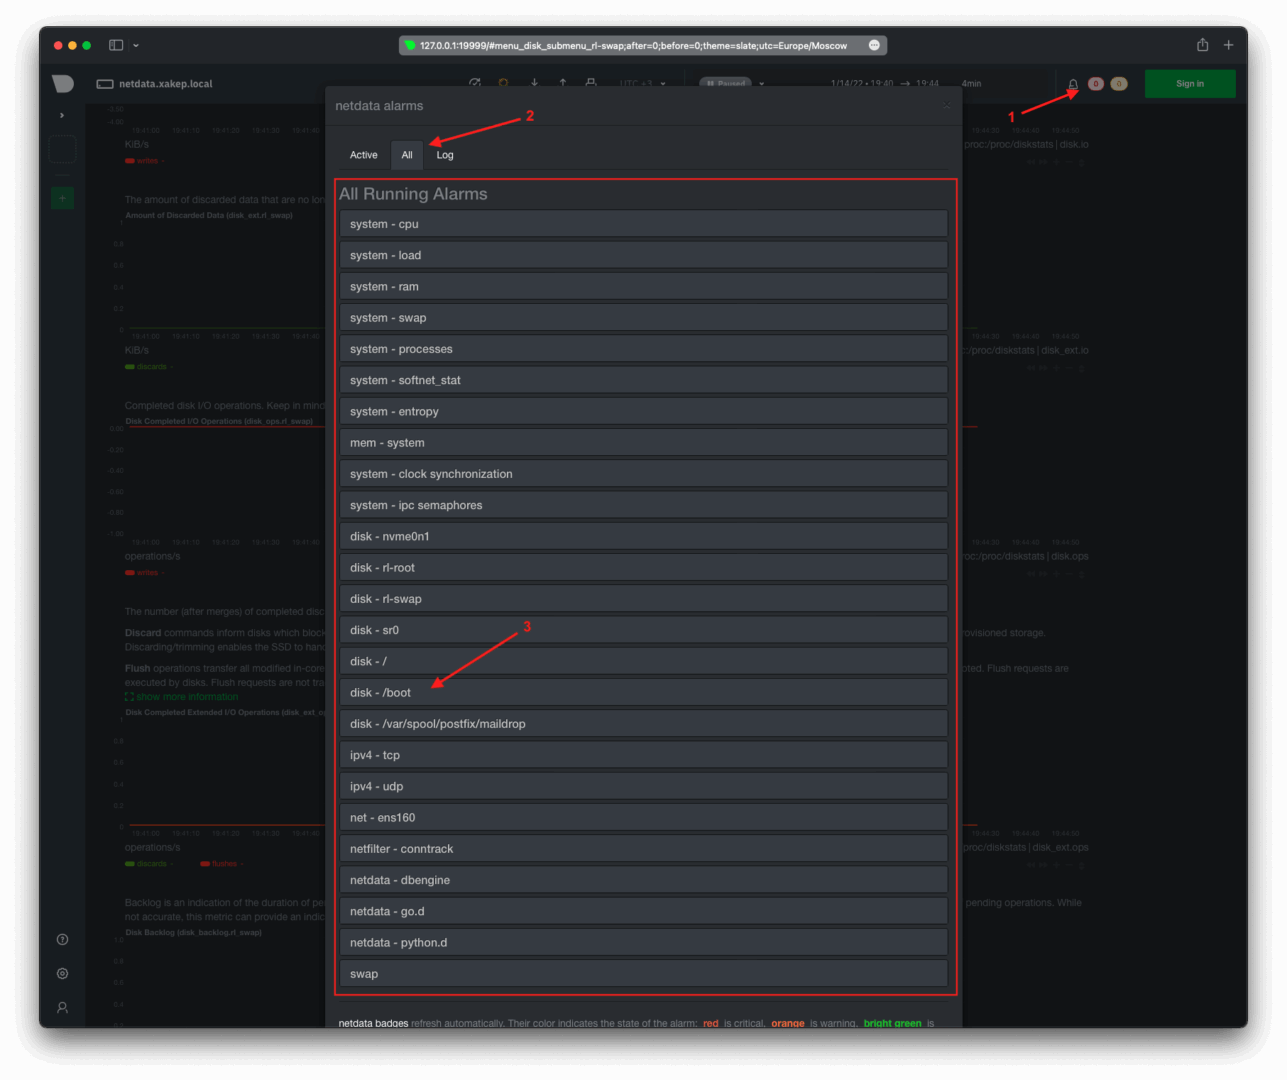
Let’s conduct a test on the / partition by writing a file of the maximum possible size to see how it handles low available space.
Check Boot Partition Usage – Utilizing Less Than 30%
To verify the disk space usage for the / partition, execute the following command:
[xakep@netdata ~]$ df -h /boot
Output:
Filesystem           Size  Used Avail Use% Mounted on
/dev/nvme0n1p2      1014M  254M  761M  26% /boot
This shows that the / partition is 26% utilized, which is under the 30% threshold.
# [
dd: writing to ‘/boot/delete_me’: No space left on device
1556449+0 records in
1556448+0 records out
796901376 bytes (797 MB, 760 MiB) copied, 5.18328 s, 154 MB/s
Check the Used Space on /boot Again — It’s 100% Full
To check the used space on /, you can use the df command:
[xakep@netdata ~]$ df -h /boot
Filesystem           Size  Used Avail Use% Mounted on
/dev/nvme0n1p2      1014M 1014M   20K 100% /boot
As shown, the / directory is completely full.
Check the current triggers in the alerts section of Netdata’s web interface. To do this, use the bell icon located at the top right and open the active alarms tab.
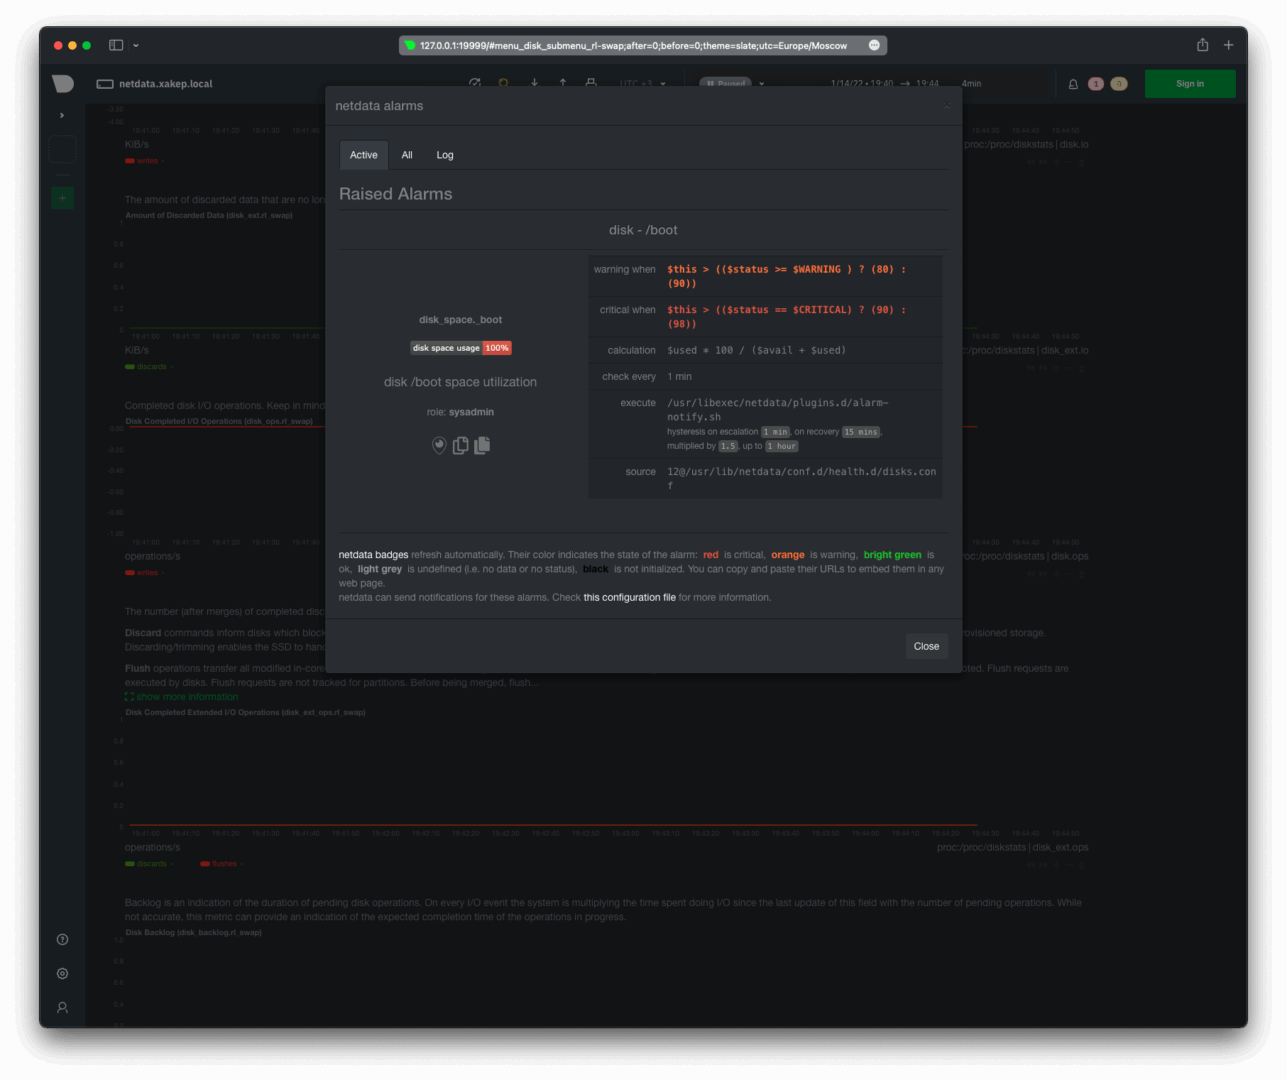
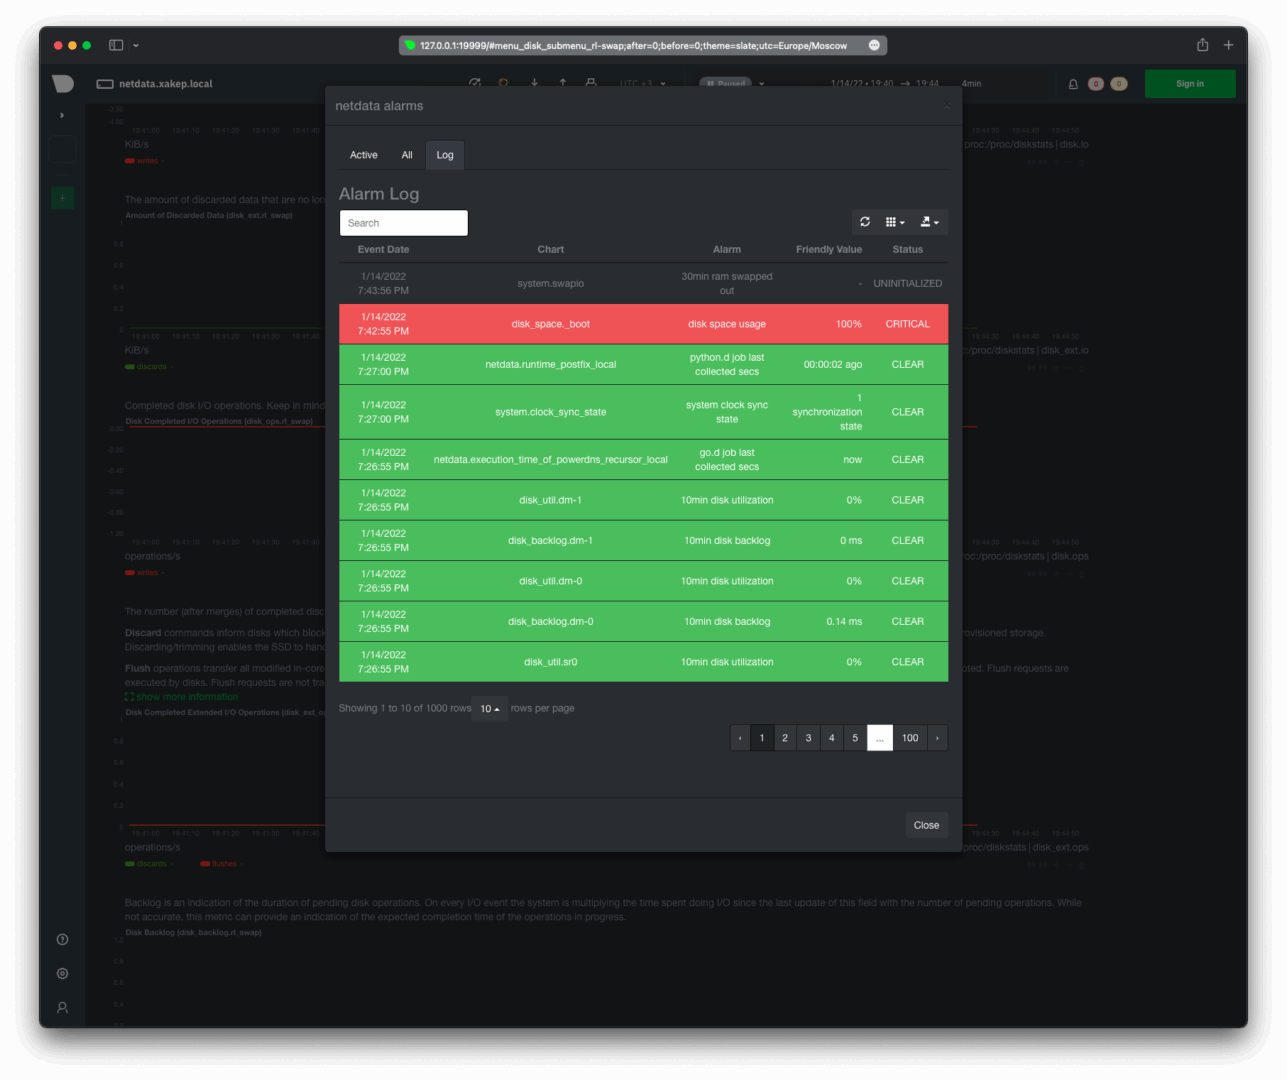
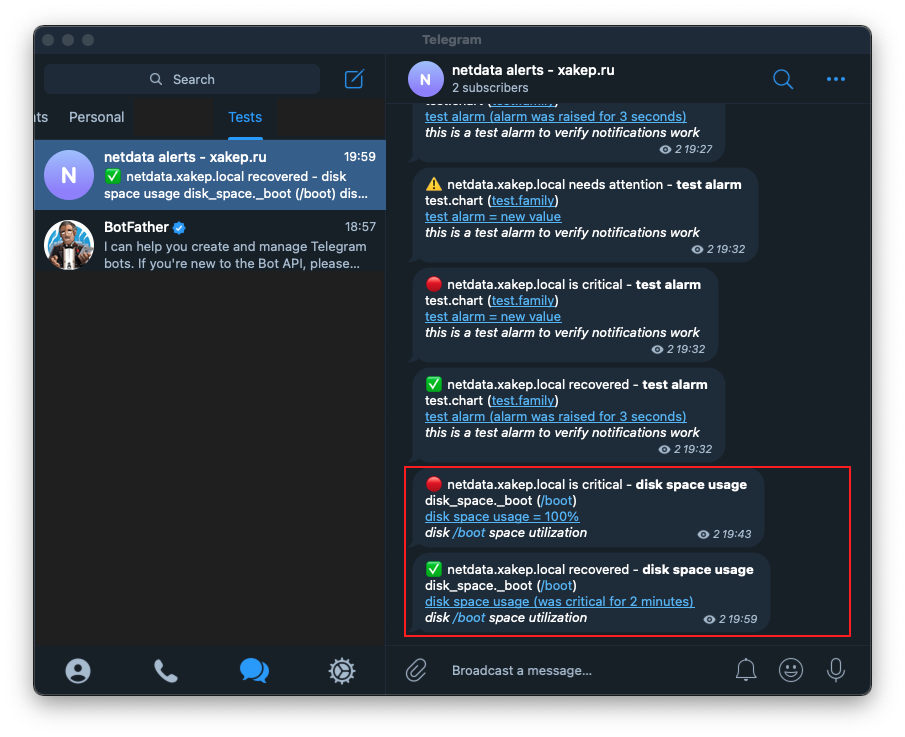
There is a notification in Telegram. Before taking the screenshot, I had already deleted the file /, so the latest notification indicates that the issue has been resolved and the event recovered has been logged.
Collecting Statistics on Services and Users
One of the key features of Netdata, in my opinion, is its ability to collect resource usage statistics by users, groups, and services. Let’s examine how this feature works, what data the agent collects, and how the statistics are presented.
Let’s start by setting up the NoSQL database server, Redis:
$ sudo yum install redis -y
$ sudo systemctl start redis
Let’s populate the database with a data array:
[
127.0.0.1:6379> KEYS *
(empty list or set)
127.0.0.1:6379> DEBUG POPULATE 2000 test 1000000
OK
(0.81s)
127.0.0.1:6379> KEYS *
- “test:1939”
- “test:1815”
- “test:1686”
- “test:778”
- …
- “test:1240”
- “test:814”
- “test:1379”
- “test:267”
Remember to restart the Netdata agent:
$ sudo systemctl restart netdata.service
When Netdata is restarted, it will automatically launch the plugin for monitoring Redis. No additional configuration is necessary.
Services/Processes Statistics
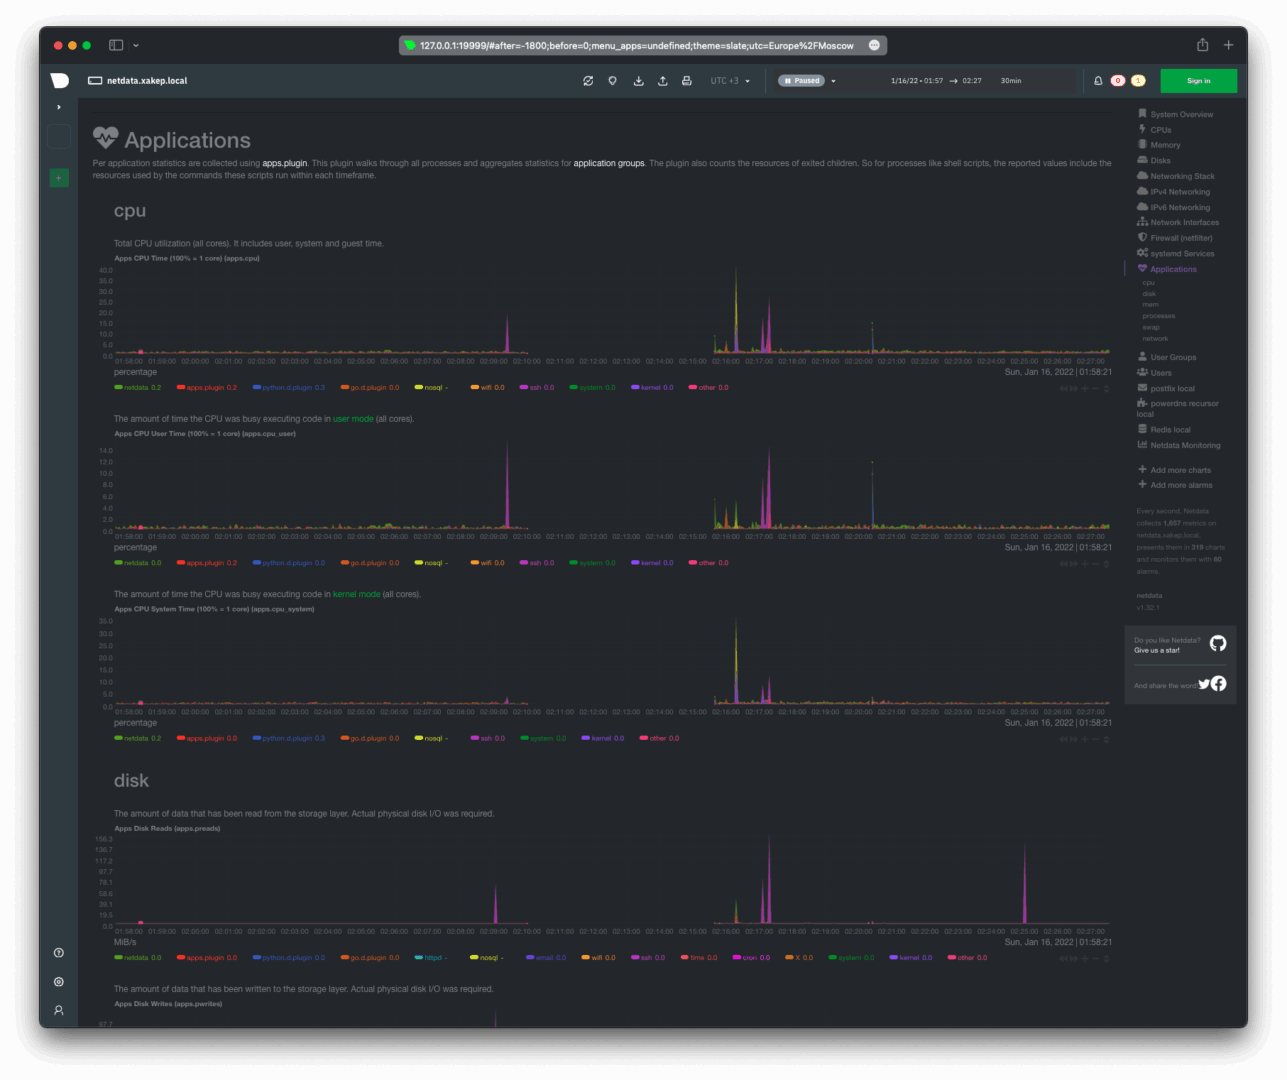
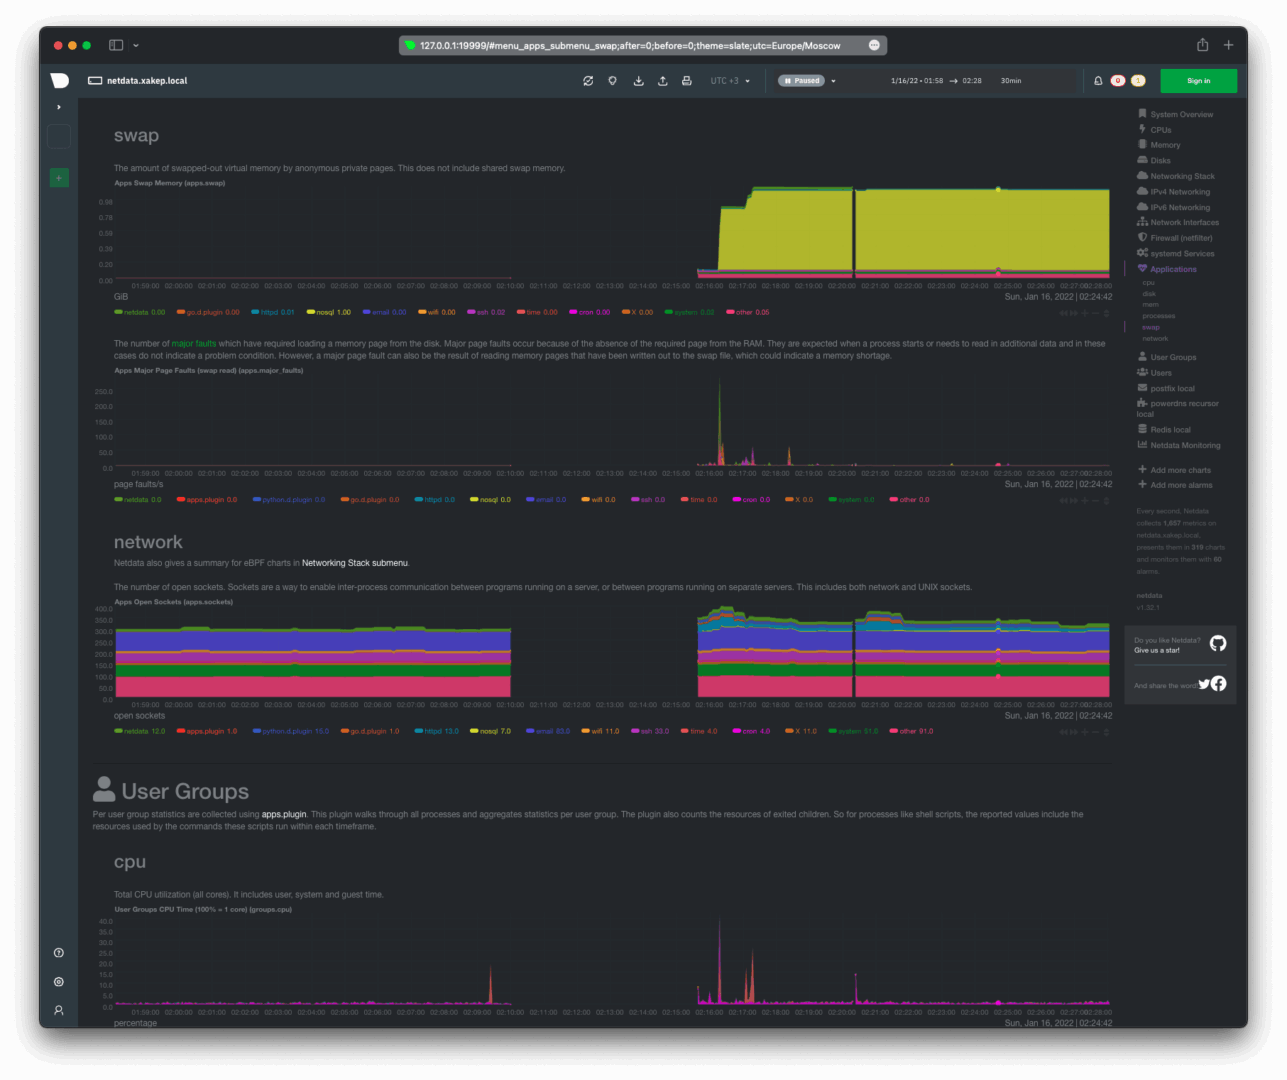
Here’s what the statistics on CPU resource consumption and input/output operations by applications and processes look like.
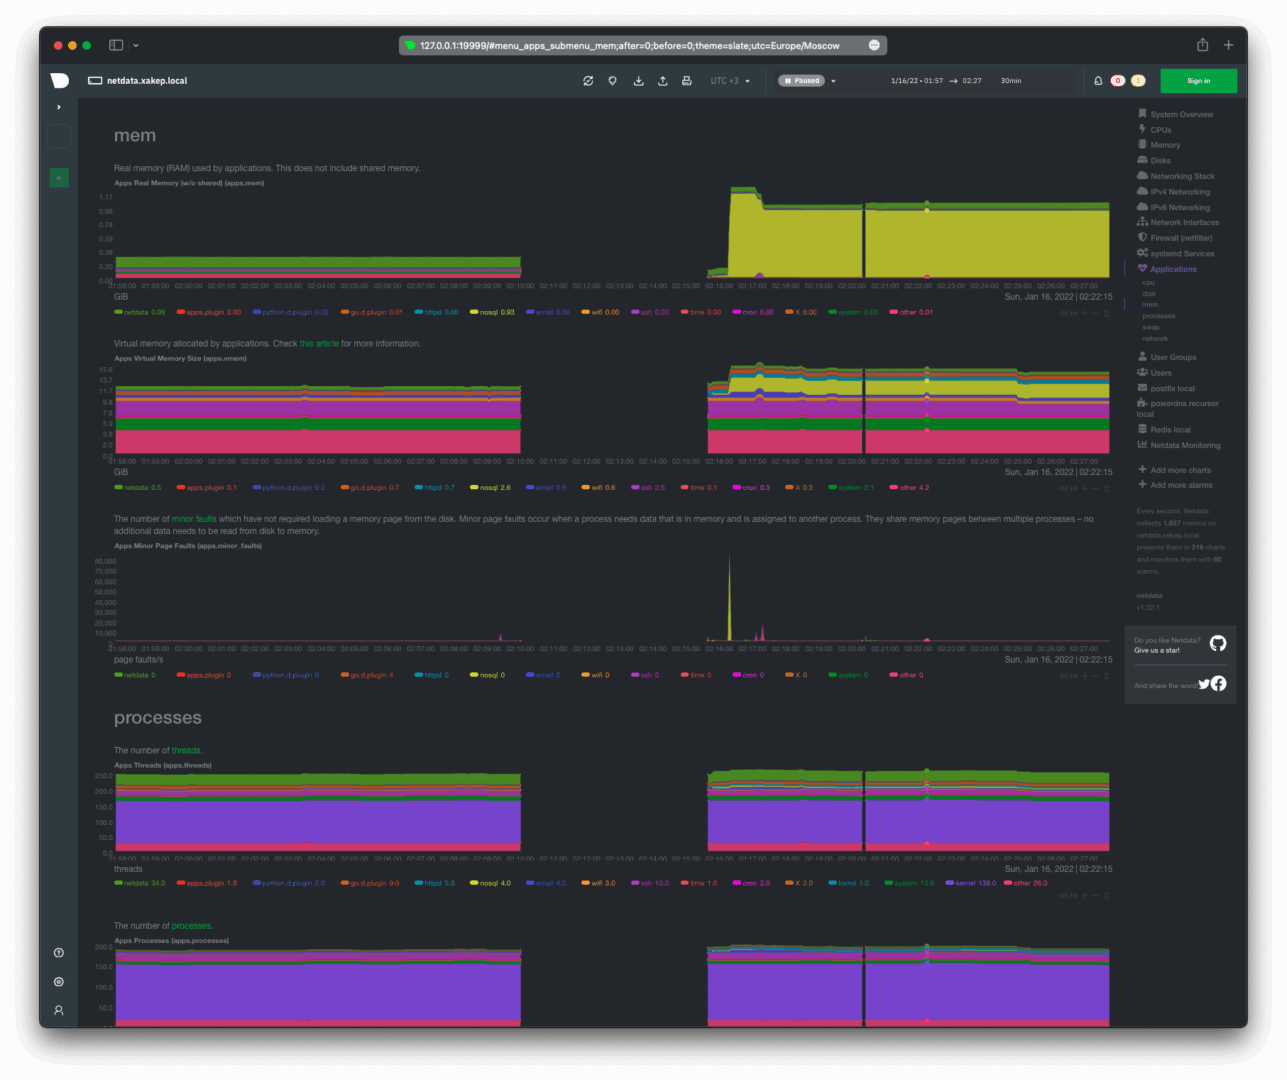
Memory usage (RAM), the number of active processes, and application threads.
Swap usage, network utilization, and the number of open sockets.
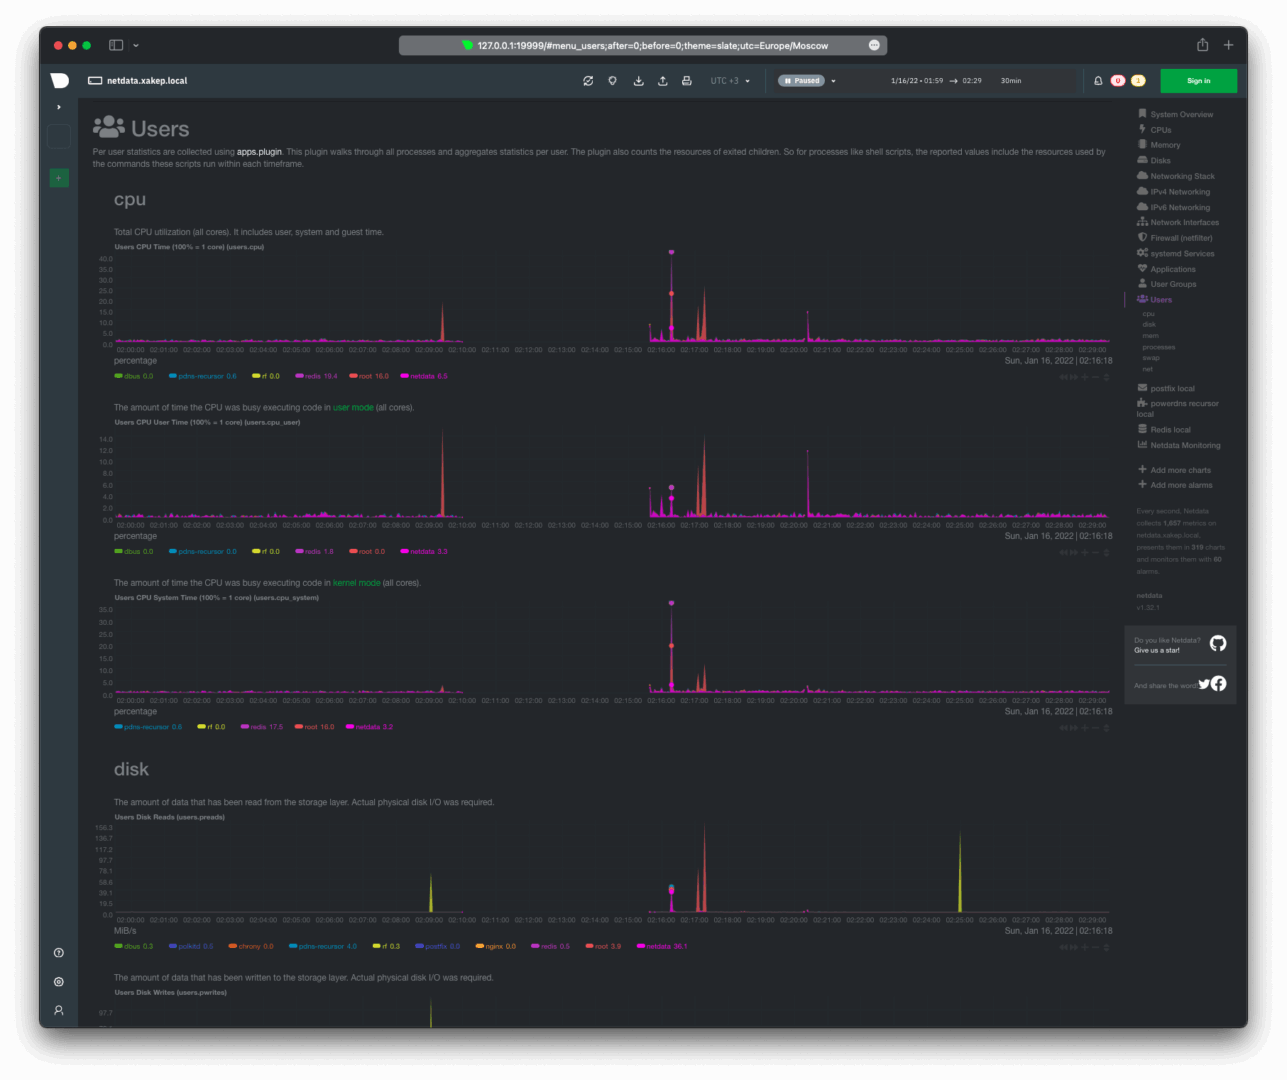
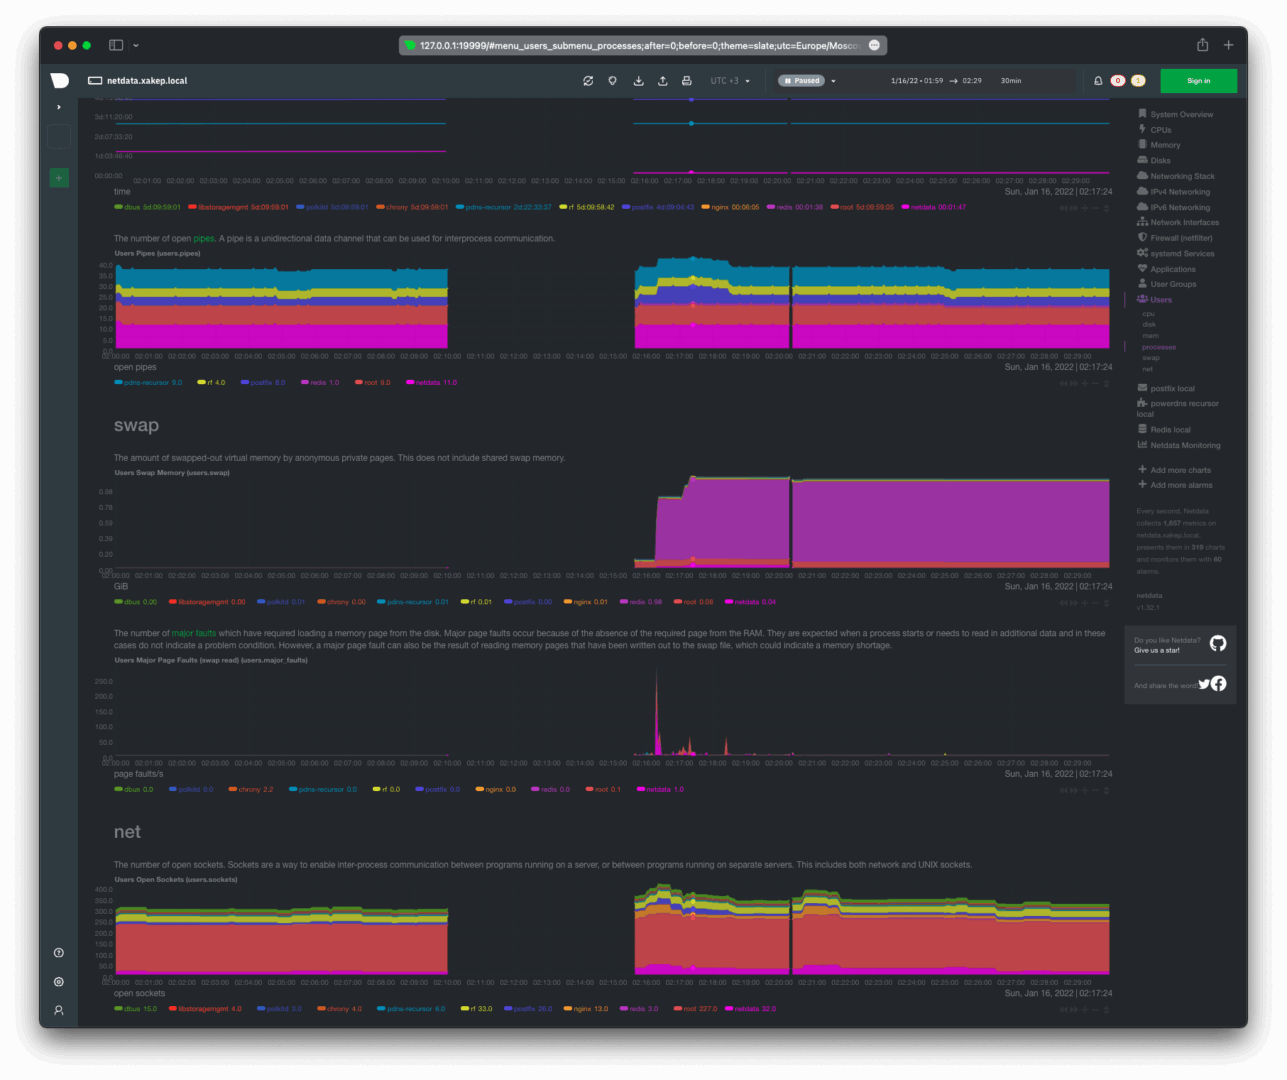
User Activity Statistics
CPU resource consumption and input-output operations performed by users.
Swap usage, network usage, and the number of open sockets by users.
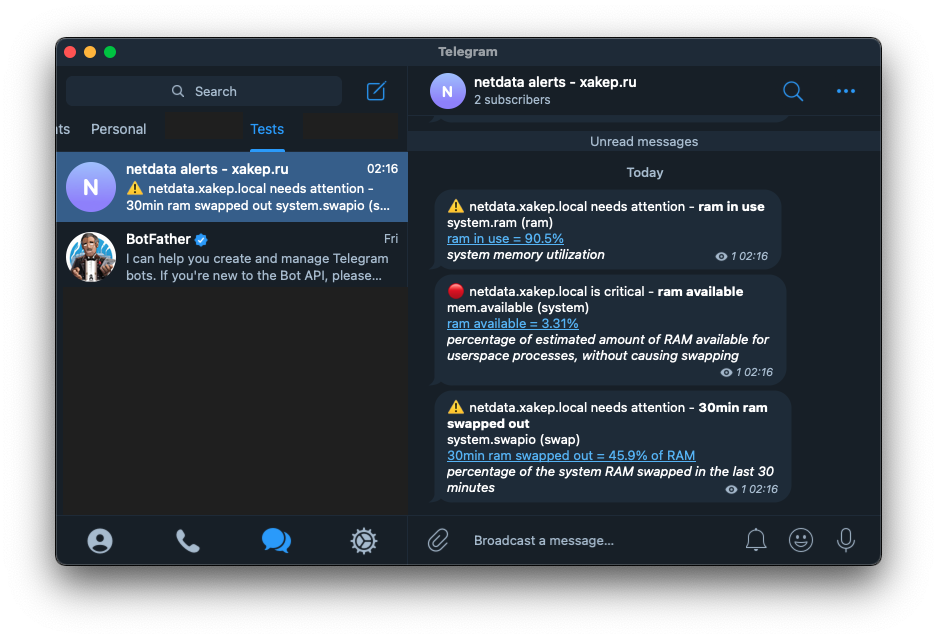
Populating the Redis database expectedly led to increased consumption of the virtual machine’s resources. This caused the available RAM to be exhausted and additionally utilized swap memory. We were immediately notified about this by the Netdata agent on Telegram.
Stopping the Redis service returns resource consumption to normal, and a notification about this is sent via Telegram.
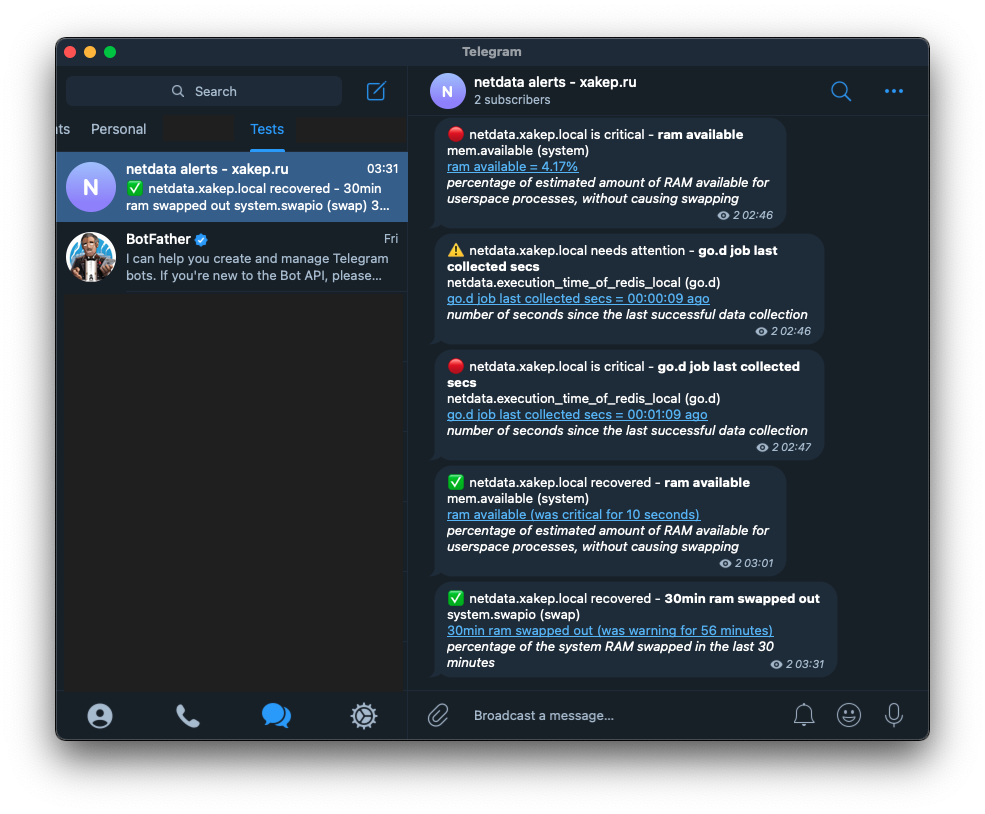
The screenshot above shows that the critical event go. has not transitioned to recovered. This is the Redis server we stopped.
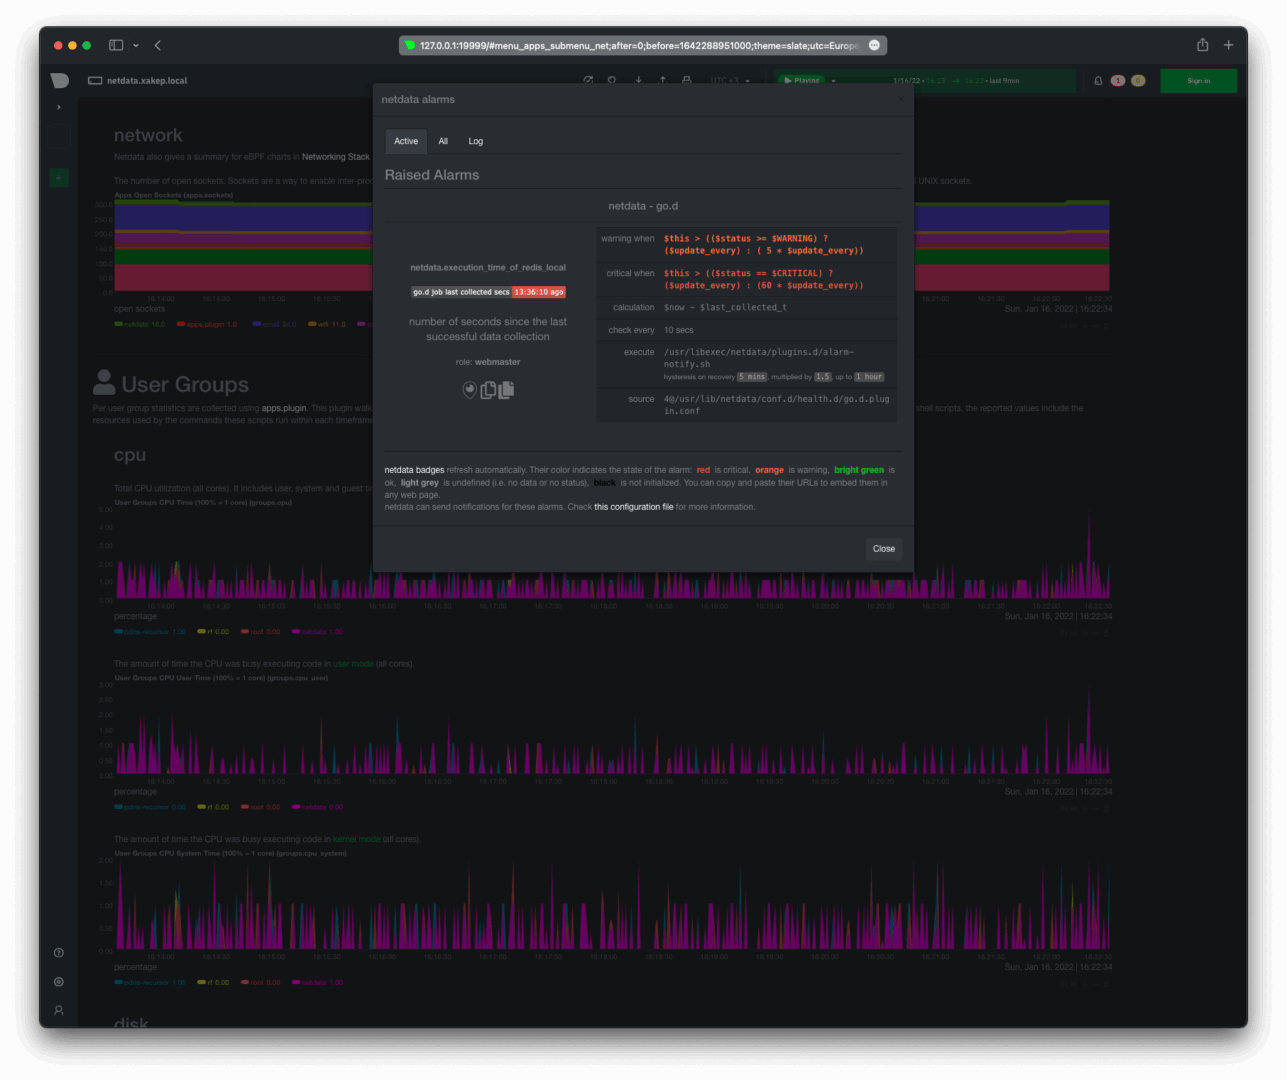
Now, let’s take a look at our dashboards. The local dashboard shows one active trigger — the Redis server is unavailable.
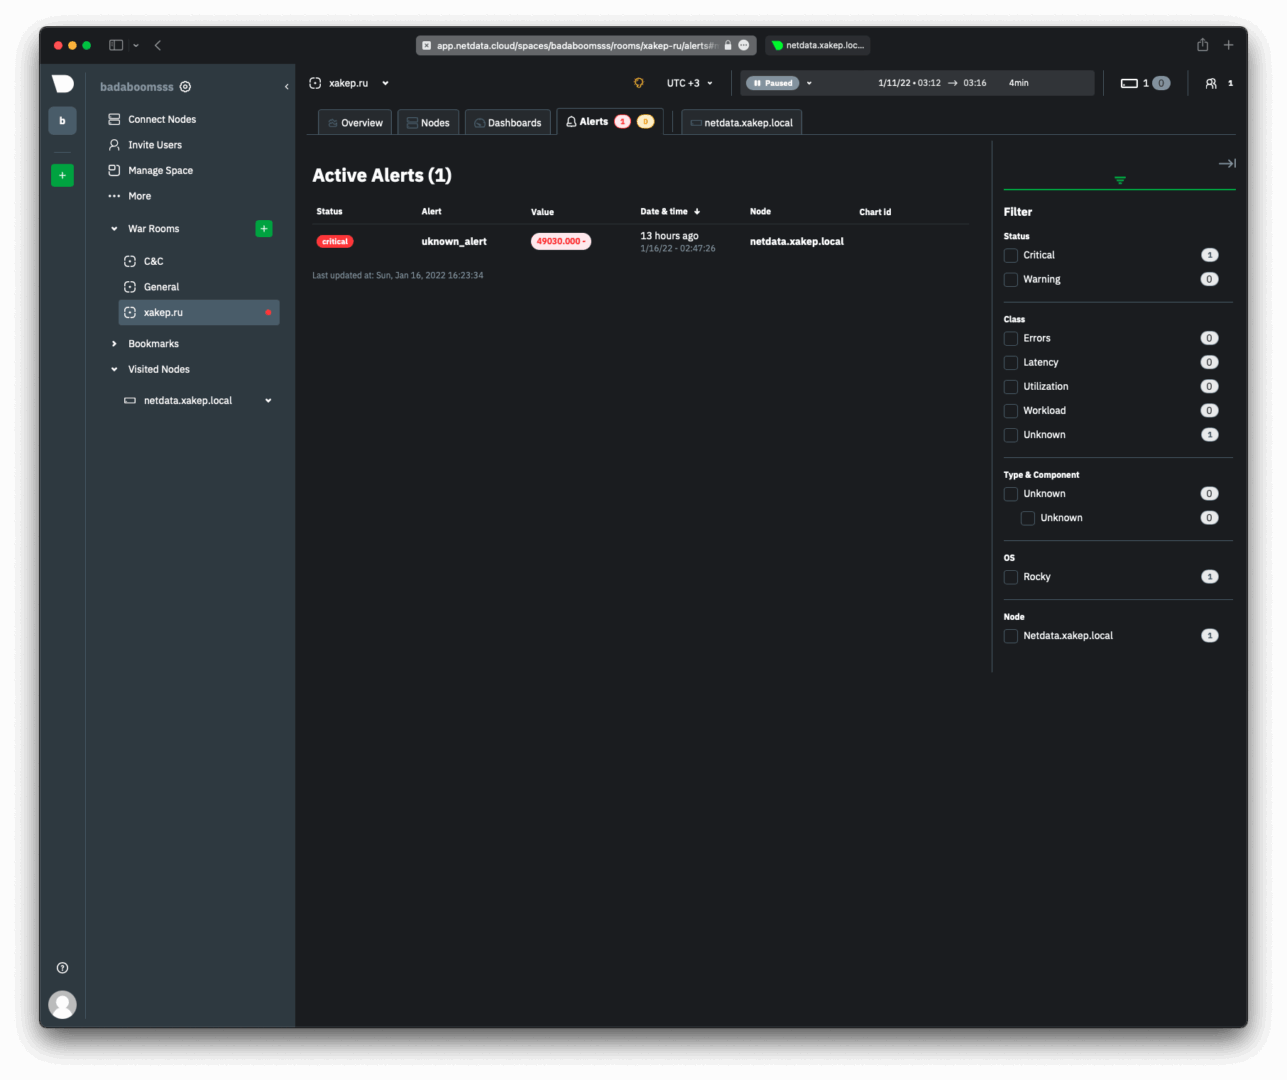
In Netdata Cloud, it’s the same trigger.
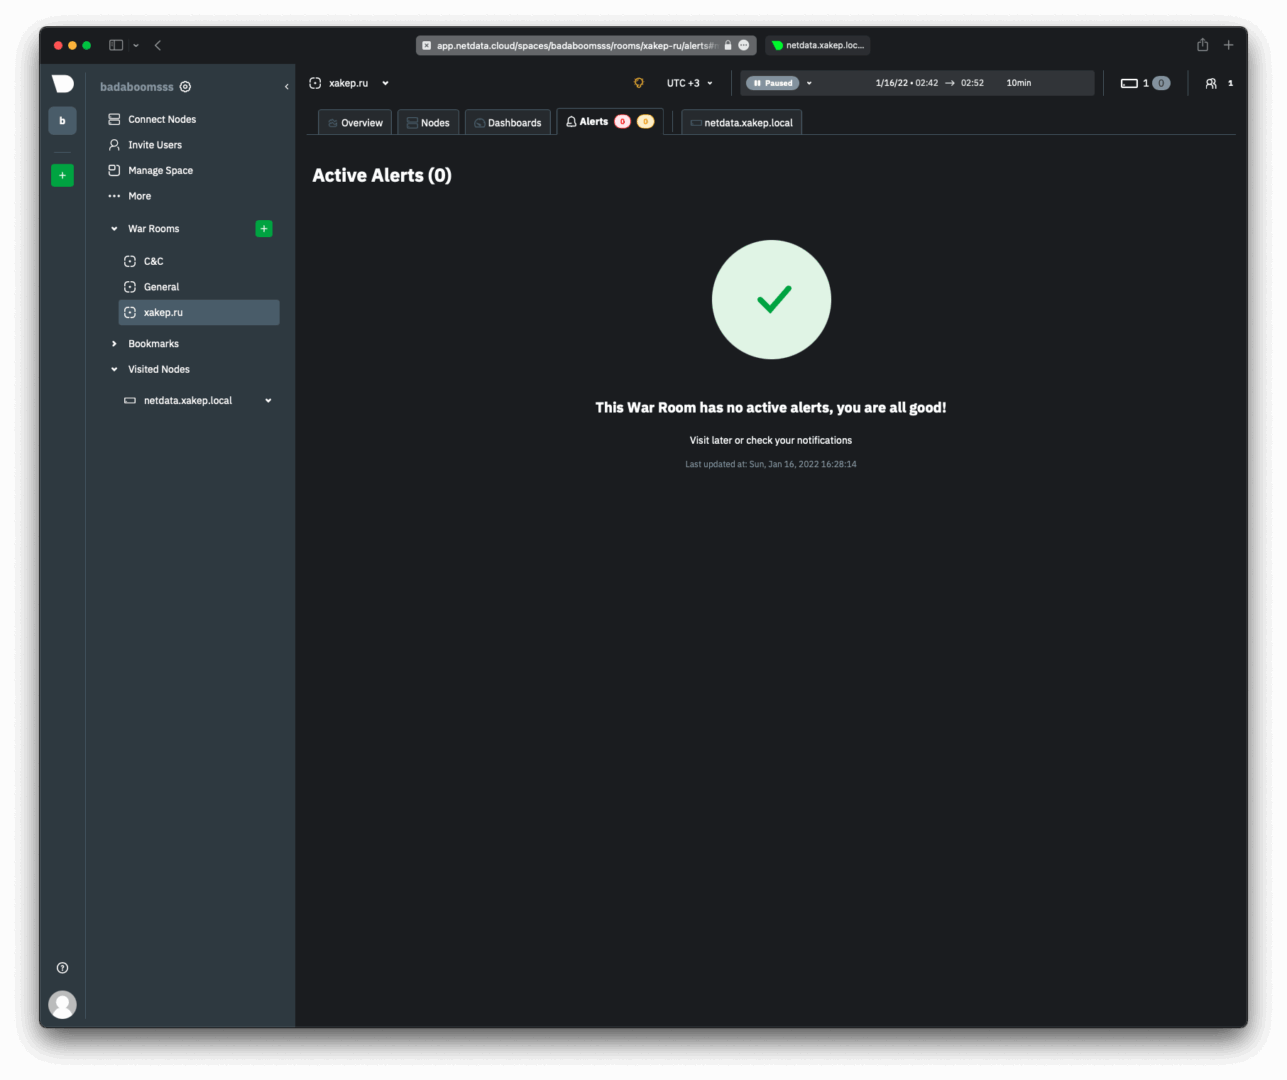
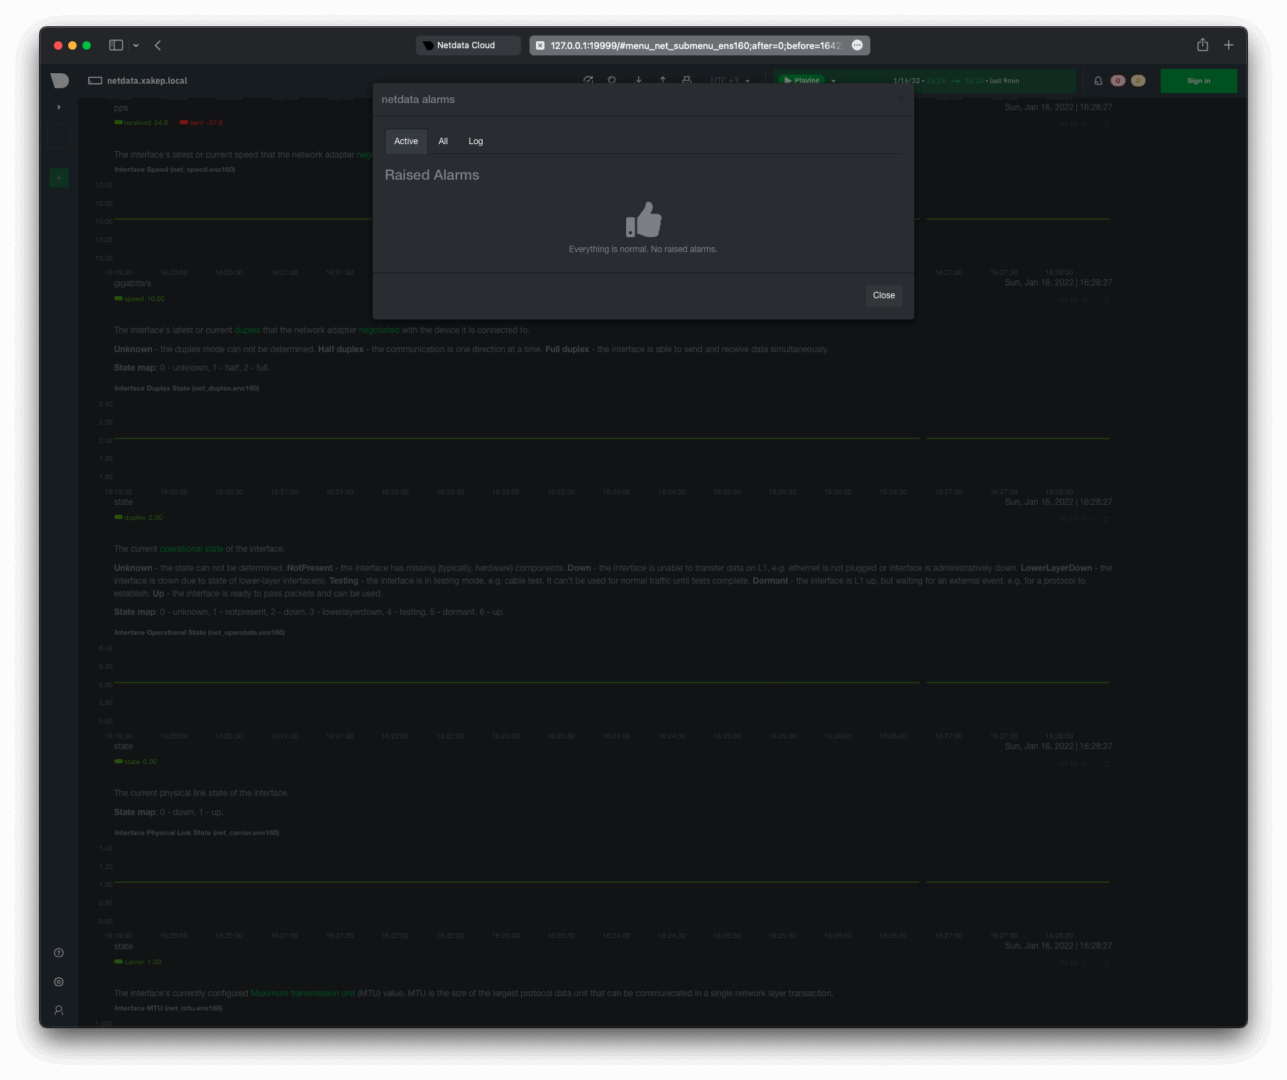
If we do not plan to use Redis further on this host, a simple restart of Netdata will unload the go. plugin. Since the Redis database is not running, the plugin won’t load unless its configuration is explicitly defined in /.
Conclusions
We explored the setup and functionality of a highly convenient, and most importantly, free monitoring tool. This tool can be used not only on heavily loaded servers but also in virtual machines, on routers, and single-board computers. Netdata features a wide range of capabilities that can be easily extended with plugins. Although this tool requires some configuration (as do most other monitoring tools for Linux), its features should be more than sufficient to handle most common tasks.
