ELK Stack
After installation, log files are scattered across directories and servers, and at best, they may be set up for rotation (and even that’s not always done). Logs are typically consulted only when apparent failures occur. However, information about issues often surfaces slightly before a service crashes. Centralized log aggregation and analysis can tackle several problems at once. Firstly, it allows you to see everything at once. Often, a service comprises multiple subsystems that might be located on different nodes, and reviewing logs one by one can obscure issues. This approach takes more time and requires manual correlation of events. Secondly, it enhances security since there’s no need to provide direct server access for log viewing to those who don’t need it, let alone explain where and what to look for. For example, developers won’t need to distract an admin to find necessary information. Thirdly, it enables parsing, processing results, and automatically selecting relevant events, along with setting up alerts. This is particularly useful once a service is operational, as small errors and issues typically begin to emerge and need swift resolution. Fourthly, storing logs separately protects them in case of a breach or service disruption, allowing analysis to commence as soon as a problem is identified.
There are commercial and cloud solutions for log aggregation and analysis—such as Loggly, Splunk, and Logentries. Among open-source solutions, the ELK stack from Elasticsearch, Logstash, and Kibana is very popular. At the core of ELK is Elasticsearch, a search engine built on the Apache Lucene library for indexing and searching information within any type of document. Logstash is used for collecting logs from various sources and centralizing their storage. It supports numerous input data types, including logs and metrics from different services. Upon receiving the data, Logstash structures, filters, analyzes, and identifies information (like geolocation from IP addresses), simplifying subsequent analysis. While our main focus is its integration with Elasticsearch, Logstash has numerous extensions enabling data output to virtually any other source.
Lastly, Kibana is a web interface designed to display logs indexed by Elasticsearch. The output can include not just textual information but, conveniently, charts and graphs as well. It can visualize geodata, generate reports, and with the installation of X-Pack, alerts become accessible. Users can customize the interface to fit their specific needs. All products are developed by the same company, which ensures seamless deployment and integration, provided everything is set up correctly.
Depending on the infrastructure, other applications can also be part of the ELK stack. For transmitting application logs from servers to Logstash, we’ll use Filebeat. Additionally, there are other components available such as Winlogbeat (for Windows Event Logs), Metricbeat (for metrics), Packetbeat (for network data), and Heartbeat (for uptime monitoring).
Installing Filebeat
Installation options include apt and yum repositories, as well as deb and rpm files. The method you choose will depend on your use case and the versions you’re working with. The current version is 5.x. If you’re starting from scratch, it’s usually straightforward. However, complications arise when older versions of Elasticsearch are in use, and updating to the latest version isn’t feasible or desirable. In such cases, you’ll need to install components of the ELK stack plus Filebeat individually, mixing repository and package installations as needed. To streamline the process, it’s advisable to document each step in an Ansible playbook, especially since ready-made solutions are already available online. For simplicity’s sake, we’ll focus on the most straightforward approach.
Connect the repository and install the packages:
$ sudo apt-get install apt-transport-https
$ wget -qO - https://artifacts.elastic.co/GPG-KEY-elasticsearch | sudo apt-key add -
$ echo "deb https://artifacts.elastic.co/packages/5.x/apt stable main" | sudo tee -a /etc/apt/sources.list.d/elastic-5.x.list
$ sudo apt-get update && sudo apt-get install filebeat
In Ubuntu 16.04 with Systemd, there’s a recurring issue where certain services marked by the package maintainer as enabled at startup don’t actually get activated and don’t start upon reboot. This is particularly relevant for Elasticsearch products.
$ sudo systemctl enable filebeat
All configurations are set in the /etc/filebeat/filebeat.yml file, which contains a template with minimal settings after installation. In the same directory, there is a file called filebeat.full.yml that lists all possible configuration options. If you find anything missing, you can use this as a basis. The filebeat.template.json file serves as a default output template. It can be overridden or modified if needed.
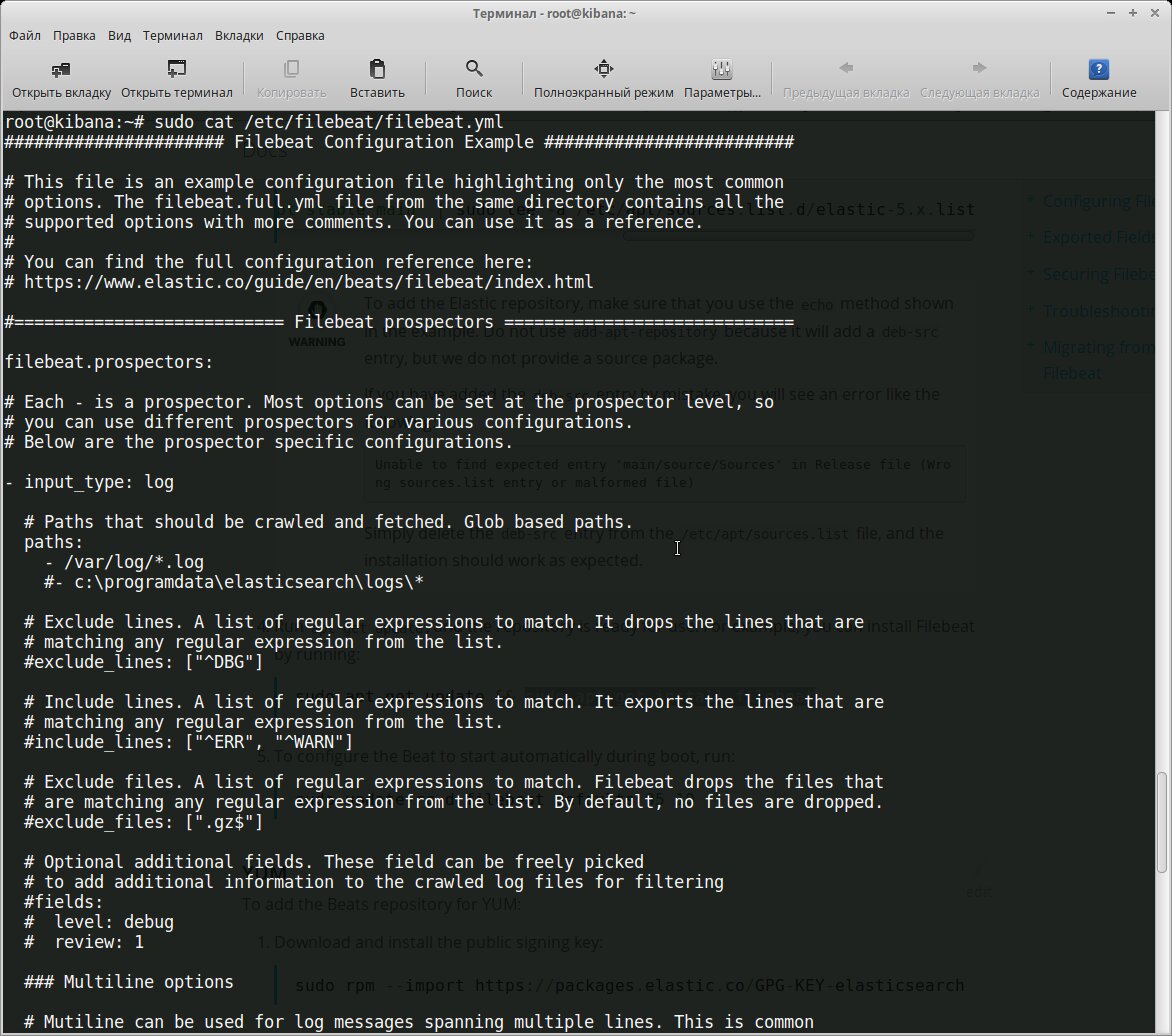
Essentially, we need to accomplish two primary tasks: specify which files to collect and where to send the output. By default, Filebeat gathers all files in the path /, meaning it will collect all files in the / directory that end with ..
filebeat.prospectors:
- input_type: log
  paths:
    - /var/log/*.log
  document_type: log
Considering that most daemons store logs in their own subdirectories, they should also be specified individually or by using a general template.
- /var/log/*/*.log
Sources with the same input_type, log_type, and document_type can be listed one per line. If they differ, a separate entry is created for each.
- paths:
- /var/log/mysql/mysql-error.log
fields:
  log_type: mysql-error
- paths:
- /var/log/mysql/mysql-slow.log
fields:
  log_type: mysql-slow
...
- paths:
- /var/log/nginx/access.log
  document_type: nginx-access
- paths:
- /var/log/nginx/error.log
  document_type: nginx-error
All types supported by Elasticsearch are compatible.
Additional options allow you to select only specific files and events. For example, we may not need to examine archives within directories:
exclude_files: [".gz$"]
By default, all lines are exported. However, you can use regular expressions to include or exclude specific data in Filebeat output. These can be specified for each path.
include_lines: ['^ERR', '^WARN']
exclude_lines: ['^DBG']
If both options are specified, Filebeat first applies include_lines, followed by exclude_lines. The order in which they are listed does not matter. Additionally, you can use tags, fields, encoding, and other configurations in the setup.
Now let’s move on to the Outputs section. Here, we specify where we’ll be sending the data. The template already includes configurations for Elasticsearch and Logstash. We need the latter.
output.logstash:
hosts: ["localhost:5044"]
This is a straightforward case. If you’re transferring to another node, it’s preferable to use key-based authentication. There’s a template in the file.
To view the result, you can output it to a file.
output:
    ...
    file:
path: /tmp/filebeat
Configuring rotation settings can be useful:
shipper:
    logging:
    files:
    rotateeverybytes: 10485760 # = 10MB
This is just the minimum. You can actually specify more parameters. They’re all available in the full file. Let’s check the settings:
$ filebeat.sh -configtest -e
....
Config OK
Applying:
$ sudo systemctl start filebeat
$ sudo systemctl status filebeat
The service might be running, but that doesn’t mean everything is set up correctly. It’s a good idea to check the log file at / to ensure there are no errors. Let’s take a look:
$ curl -XPUT 'http://localhost:9200/_template/filebeat' -d@/etc/filebeat/filebeat.template.json
{"acknowledged":true}
Another important point: log files don’t always contain the necessary information by default. It might be a good idea to review and adjust their format if possible. When analyzing the performance of nginx, request timing statistics can be quite helpful.
$ sudo nano /etc/nginx/nginx.conf
log_format logstash  '$remote_addr - [$time_local] $host "$request" '
    '$status $body_bytes_sent "$http_referer" '
    '"$http_user_agent" $request_time '
    '$upstream_response_time $request_uuid';
access_log /var/log/nginx/access.log logstash;
Installing Logstash
Logstash requires Java 8, and version 9 is not supported. You can use either the official Java SE or OpenJDK, which is available in the repositories of Linux distributions.
$ sudo apt install logstash
$ sudo systemctl enable logstash
A Logstash pipeline requires two main components: input and output. Additionally, it can include an optional filter component. Input plugins collect data from a source, output plugins send it to a destination, and filters transform the data based on specified patterns. The -e flag allows you to specify the configuration directly in the command line, which can be useful for testing purposes. Let’s run the simplest pipeline:
$ /usr/share/logstash/bin/logstash -e 'input { stdin { } } output { stdout {} }'
It’s not doing anything particularly smart, it’s simply outputting whatever comes through stdin. You can input any message, and Logstash will duplicate it, adding a timestamp.

All configuration files are located in /. The settings in / and jvm. define startup parameters, while logstash. specifies the operational settings of the service itself. Pipelines are described in files within /. Currently, this directory is empty. How you organize the filters is up to you. Connections to services can be described in a single file, or you can separate files by type — input, output, and filter — whatever suits your needs best.
Connecting to Filebeat.
$ sudo nano /etc/logstash/conf.d/01-input.conf
input {
  beats {
  port => 5044
  }
}
Here, if necessary, you can specify the certificates required for authentication and connection security. Logstash can independently gather information from the local host.
input {
  file {
  path => "/var/log/nginx/*access*"
  }
}
In this example, “beats” and “file” refer to the names of specific plugins. A complete list of plugins for inputs, outputs, and filters, along with their supported parameters, can be found on the official website.
Once installed, the system already includes some plugins. You can easily obtain a list of them using a specific command:
$ /usr/share/logstash/bin/logstash-plugin list
$ /usr/share/logstash/bin/logstash-plugin list --group output
We cross-check the list with the website, update what’s needed, and install the necessary items.
$ /usr/share/logstash/bin/logstash-plugin update
$ /usr/share/logstash/bin/logstash-plugin install logstash-output-geoip --no-verify
If you have multiple systems, you can use the logstash-plugin command to create a package and distribute it to other systems.
Sending data to Elasticsearch.
$ sudo nano /etc/logstash/conf.d/02-output.conf
output {
  elasticsearch {
  hosts => ["localhost:9200"]
  }
}
And the most interesting part—filters. We create a file that will process data of type nginx-access.
$ sudo nano /etc/logstash/conf.d/03-nginx-filter.conf
filter {
    if [type] == "nginx-access" {
        grok {
                match => { "message" => "%{NGINXACCESS}" }
            overwrite => [ "message" ]
        }
        date {
                locale => "en"
            match => [ "timestamp" , "dd/MMM/YYYY:HH:mm:ss Z" ]
        }
    }
}
For data analysis in Logstash, you can use several filters. Grok is probably the best option, allowing you to transform any unstructured data into something structured and queryable. By default, Logstash includes around 120 patterns, which you can view on GitHub. If these are insufficient, you can easily create your own patterns by specifying them directly in the match string, which can be inconvenient, or by writing them in a separate file, assigning a unique name to the pattern, and telling Logstash where to find them (if the patterns_dir variable is not set).
patterns_dir => ["./patterns"]
To verify the accuracy of your rules, you can use the Grok Debugger or the Grok Constructor websites. These sites also offer pre-built patterns for various applications.
Let’s create a filter to select the NGINXACCESS event for nginx. The format is straightforward—consisting of a template name and its corresponding regular expression.
$ mkdir /etc/logstash/patterns
$ cat /etc/logstash/patterns/nginx
NGUSERNAME [a-zA-Z.@-+_%]+
NGUSER %{NGUSERNAME}
NGINXACCESS %{IPORHOST:http_host} %{IPORHOST:clientip} [%    {HTTPDATE:timestamp}] "(?:%{WORD:verb} %{NOTSPACE:request}(?: HTTP/%{NUMBER:httpversion})?|%{DATA:rawrequest})" %{NUMBER:response} (?:%{NUMBER:bytes}|-) %{QS:referrer} %{QS:agent} %{NUMBER:request_time:float} ( %{UUID:request_id})
Restarting:
$ sudo service logstash restart
We verify in the logs to ensure everything is functioning properly.
$ tail -f /var/log/logstash/logstash-plain.log
[INFO ][logstash.inputs.beats  ] Beats inputs: Starting input listener {:address=>"localhost:5044"}
[INFO ][logstash.pipeline  ] Pipeline main started
[INFO ][logstash.agent  ] Successfully started Logstash API endpoint {:port=>9600}
Installing Elasticsearch and Kibana
It’s the perfect time to set up Elasticsearch:
$ sudo apt install elasticsearch
$ sudo systemctl enable elasticsearch
By default, Elasticsearch listens on the local port 9200. In most cases, it’s best to leave it this way to prevent unauthorized access. If the service is within a network or accessible via VPN, you can assign an external IP and change the port if it is already in use.
$ sudo nano /etc/elasticsearch/elasticsearch.yml
#network.host: 192.168.0.1
#http.port: 9200
It’s important to remember that Elasticsearch is memory-intensive (by default, it runs with -Xms2g ). You might need to adjust these values by decreasing or increasing them in the / file, but make sure they don’t exceed 50% of your system’s RAM.
The same goes for Kibana:
$ sudo apt-get install kibana
$ sudo systemctl enable kibana
$ sudo systemctl start kibana
By default, Kibana runs on localhost:5601. In a testing environment, you can allow remote connections by changing the server. setting in the / file. However, since there is no built-in authentication, it is recommended to use nginx as a front, configuring a standard proxy_pass and access control with htaccess for security.
First and foremost, you need to inform Kibana about the Elasticsearch indices you’re interested in by setting up one or more index patterns. If Kibana doesn’t find a matching pattern in the database, it won’t let you activate it upon entry. The simplest pattern, *, lets you view all the data and get your bearings. For filebeat, use the pattern filebeat-* and in the Time-field name, enter @timestamp.
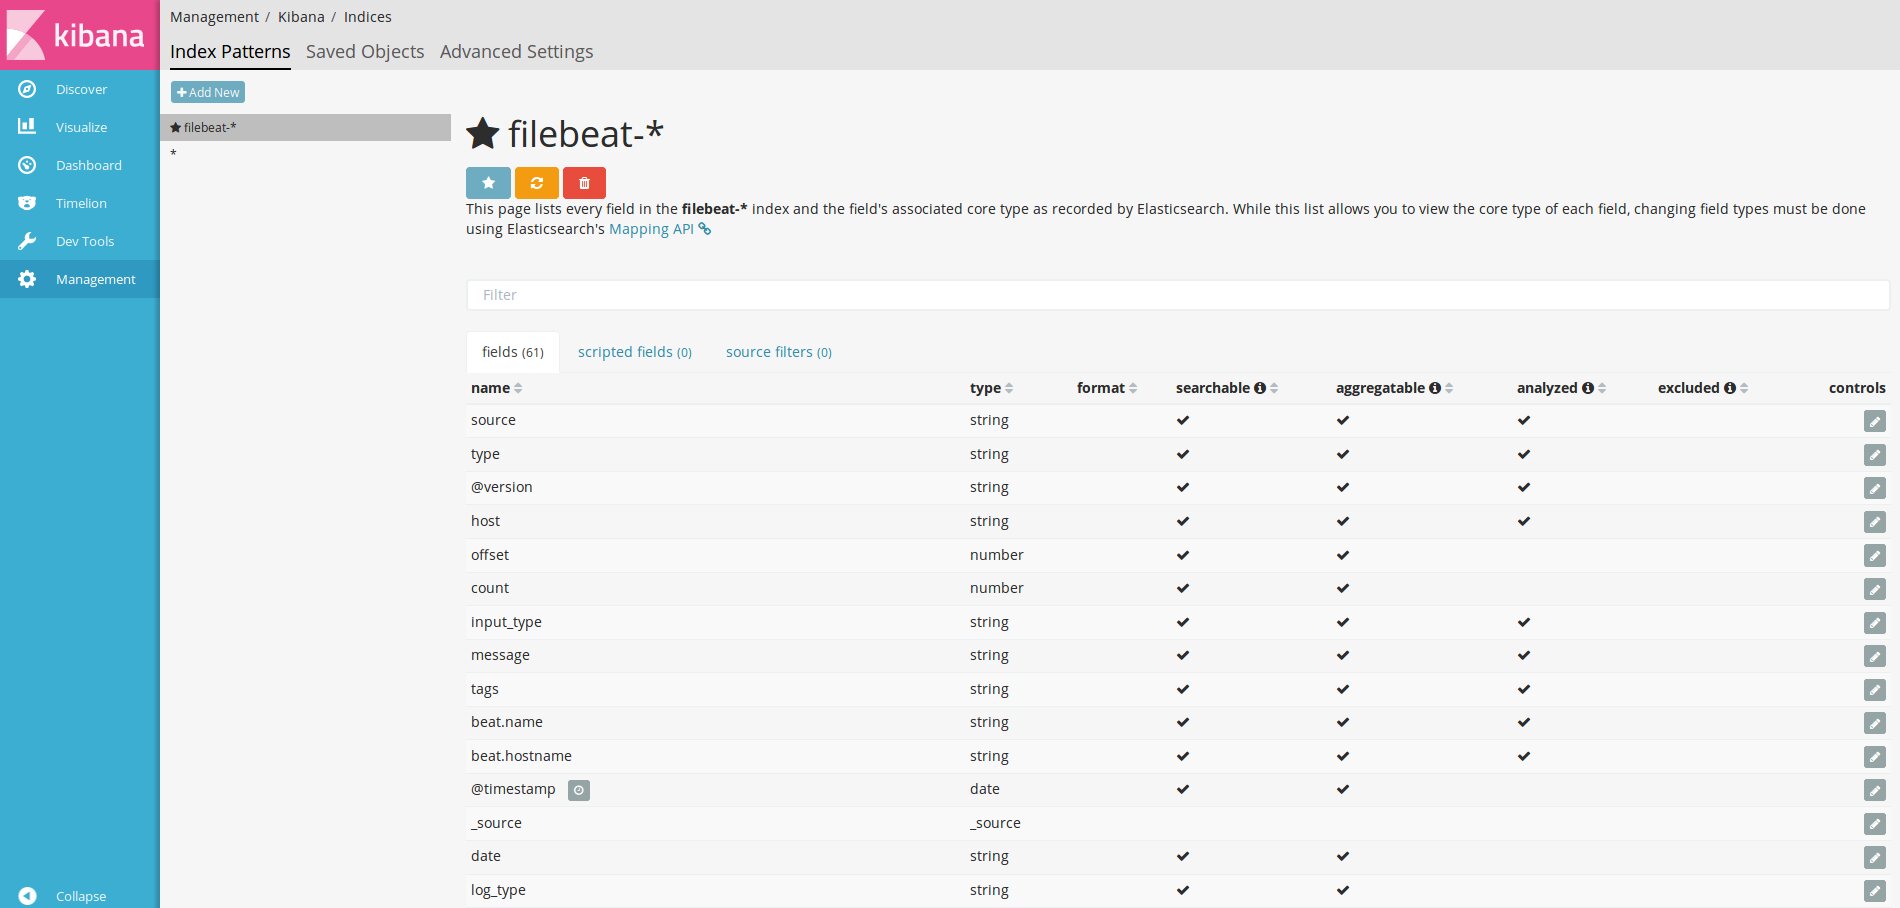
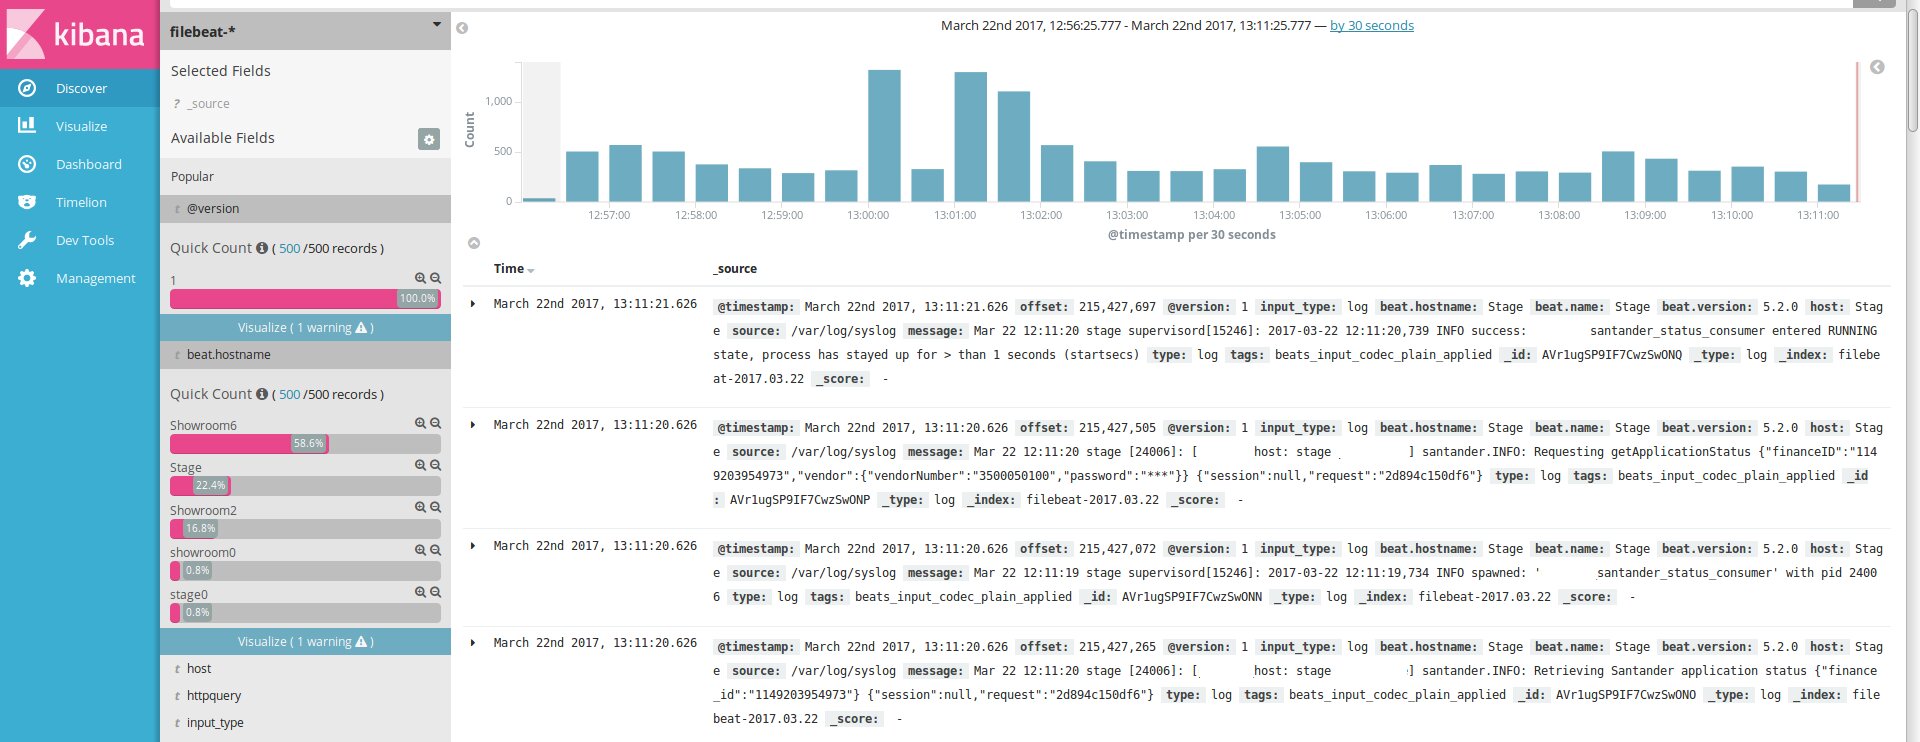
After that, if the agents are properly connected, logs will start appearing in the Discover section.
Next, we move through the tabs step by step to configure the charts and the Dashboard.
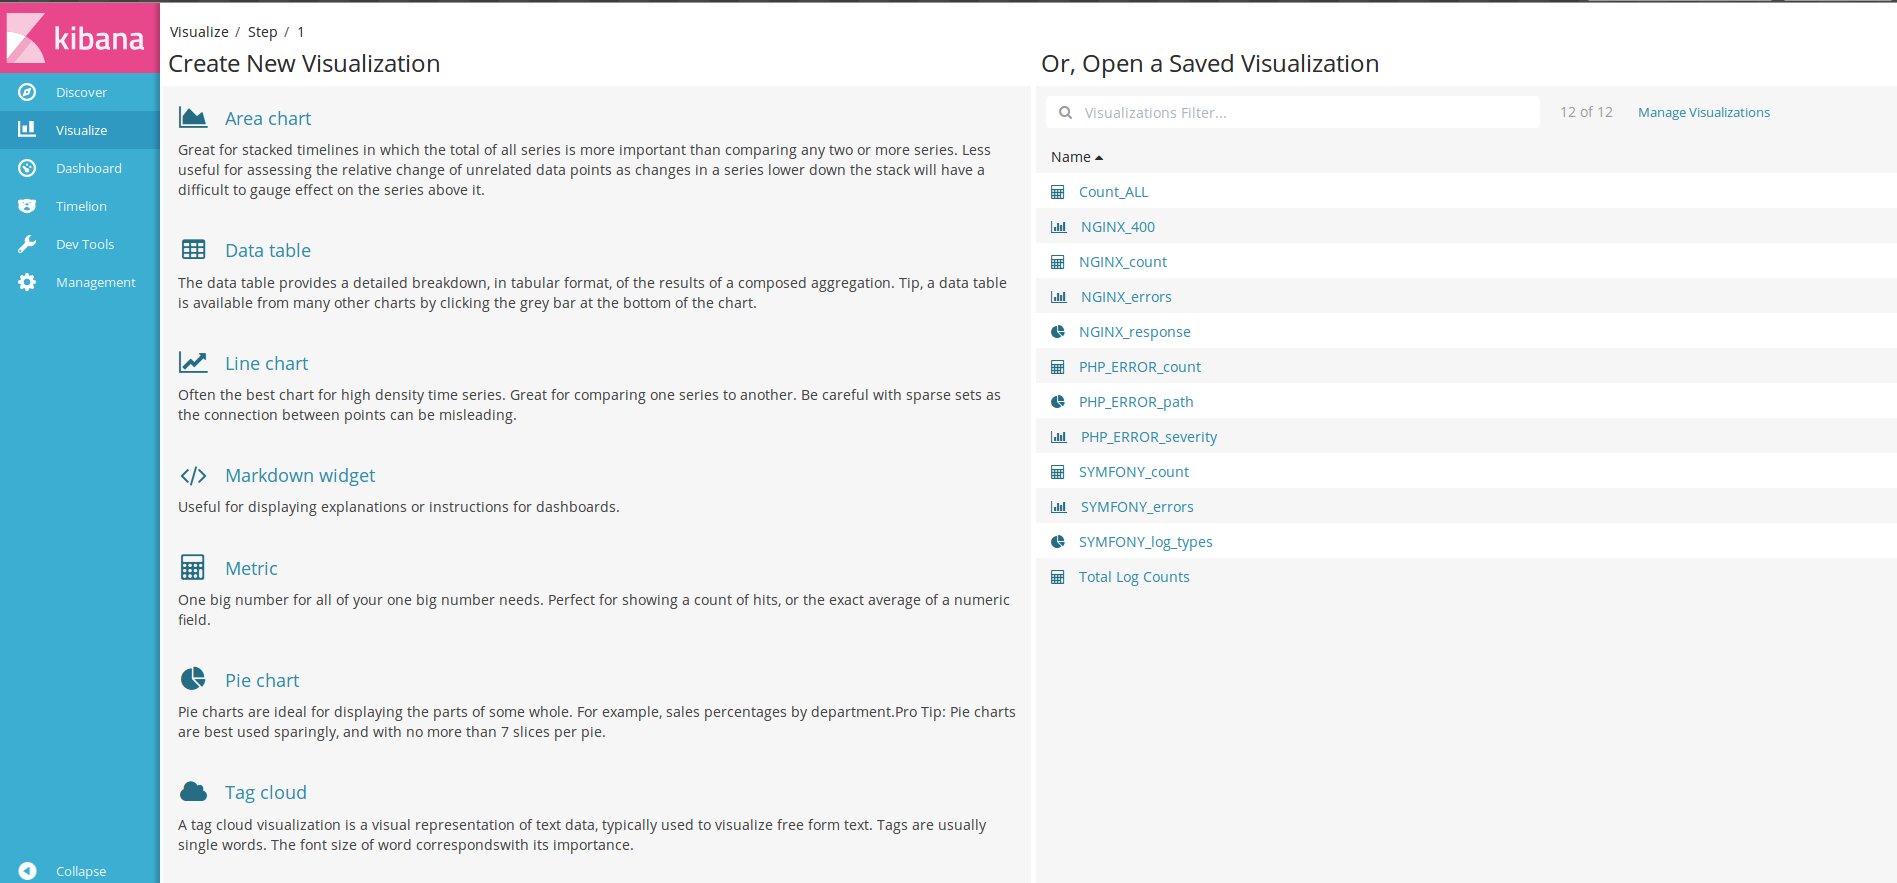
Pre-built Dashboard setups can be found online and imported into Kibana.
$ curl -L -O http://download.elastic.co/beats/dashboards/beats-dashboards-1.3.1.zip
$ unzip beats-dashboards-1.3.1.zip
$ cd beats-dashboards-1.3.1/
$ ./load.sh
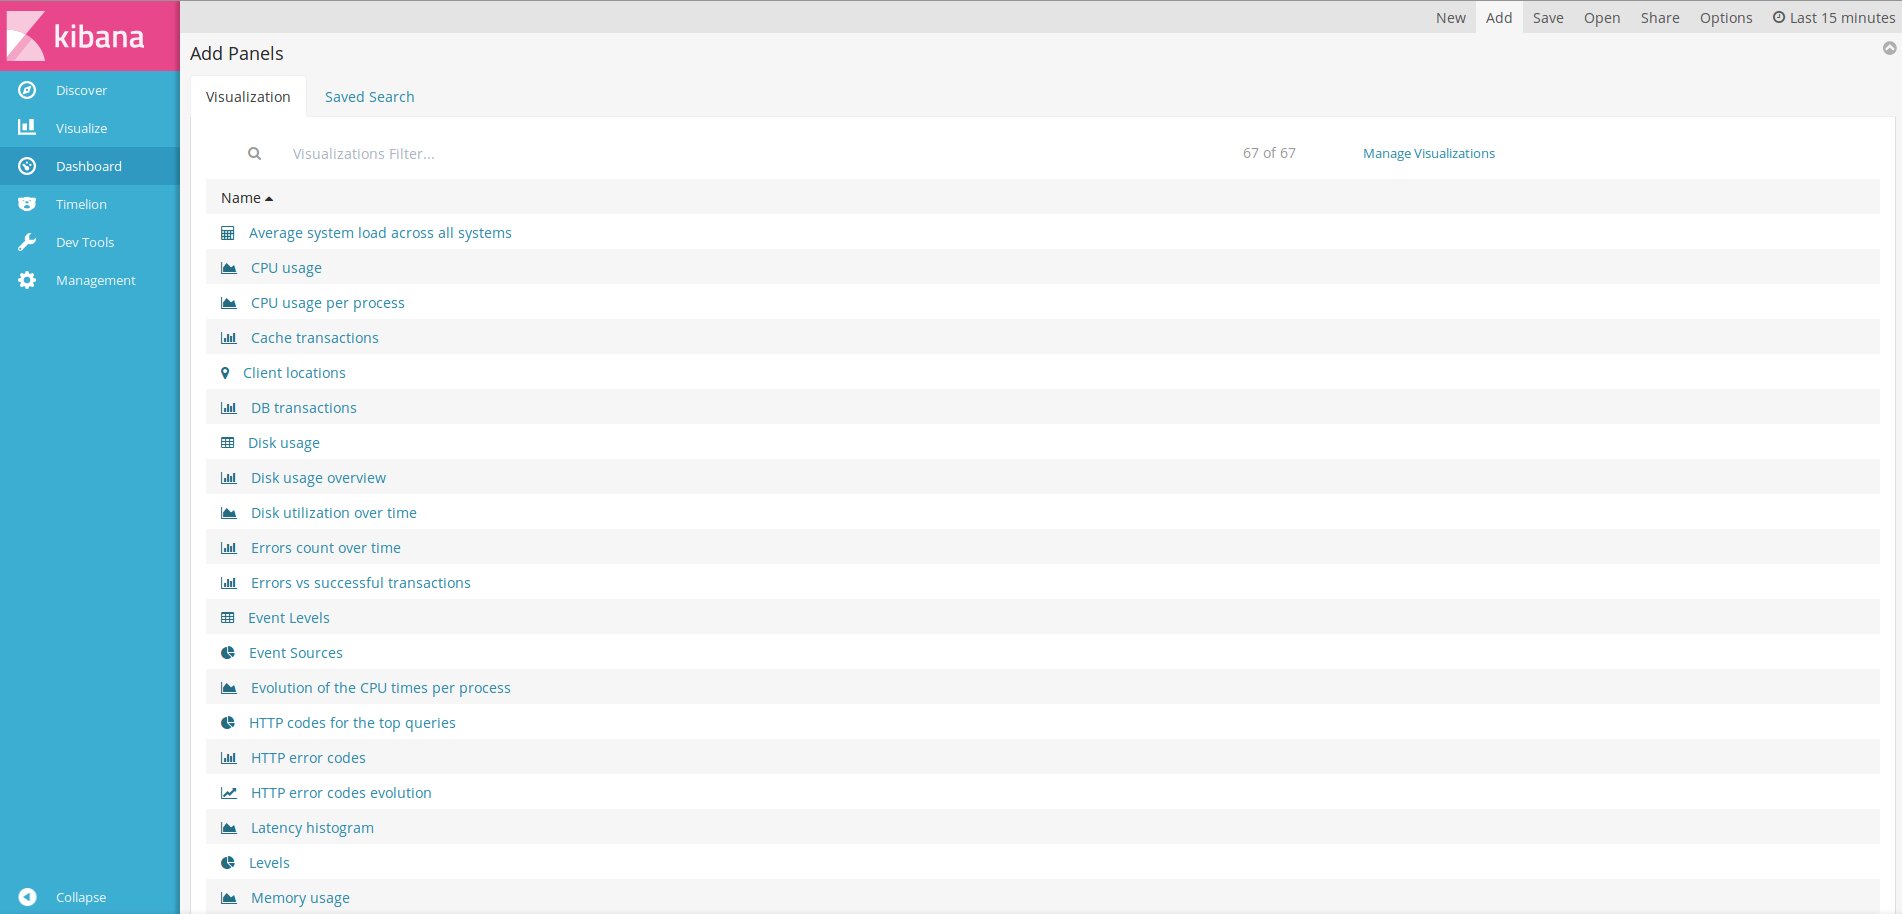
After importing, go to the Dashboard, click on Add, and select the desired option from the list.
Conclusion
Done! We have at least the basics set up. From here, Kibana can be easily customized to meet the specific needs of any network.
