
info
If you are interested in creating modifications for “Pathologic”, we can combine our efforts: join the game reverse-engineering chat!
Information collection
Scripts are stored in the file Scripts.. The format is makeshift and very simple. The easiest way to unpack this archive is to use ready-made software VFS Explorer.
The archive contains plenty of binary files with the . extension. The first four bytes don’t contain any noticeable signature.
Normally, developers use time-tested scripting languages (e.g. Lua or Python) in their products. In “Pathologic”, you are dealing with binary files, which indicates that its scripts have been compiled. However, the sparse (full of zeros) bytecode leaves no doubt that the script format is proprietary. Only makeshift languages use file space so wastefully compared to optimized processor opcodes. Zeros in the bytecode can indicate that the instruction takes up a fixed number of bytes, but no arguments were passed to it.
First of all, I searched Google for mods and found a partial description of the file format. It helped at the initial stage, but the document ends in the middle of the header list…. So, I had no choice but to start the oldie-goodie debugger and analyze the code myself.
This research became possible thanks to the recent publication of the alpha version of “Pathologic”. Its main advantage is that the executable files are accompanied by . files containing prototypes of functions and all structures used in the game. These debug symbols made it possible to reduce the research time from several months to a couple of weeks.
Searching for an entry point
To find out what fields are used in this proprietary format, you have to find the place where scripts are read in the game code. For this purpose, I suggest to run “Pathologic” in x64dbg, a modern alternative to OllyDbg. The debugger automatically loads symbols from disk and assigns original names to addresses in memory.
But first, let’s disable full-screen mode by editing config.:
[Video]XRes = 1024YRes = 768Fullscreen = 0Now you can interact with the game in the debugger without worries that it can crash any second leaving you no choice but to restart the system. To find out what files are opened by the game, conditional breakpoints can be used. Go to the WinAPI function CreateFileA and create the following breakpoint:
Log text: OPEN: {ansi@[ESP+4]}
Break condition = 0
Log condition = 1
The following data can be added to the log: string formatting and expression functions. In this particular case, let’s instruct the debugger to add an entry to the log for each opened file; the path to this file can be obtained via the stack (in fact, you just take the string from the first argument of the CreateFileA function).
Start the game, and you’ll see zillions of game assets in the log:
OPEN: C:\games\pathologic\alpha\data\scripts\fire.bin
Hmm, this seems to be interesting. The scripts are packed in an archive, but for debugging or patching purposes, the game first tries to read them from the disk. And only if they aren’t there, it reads the contents of these files from the game archive. This significantly simplifies modding.
Let’s say I want to pause the debugger on a specific file. To do so, I slightly edit the breakpoint:
Breakpoint condition = strstr(ansi([ESP+4]), "fire.bin")
The strstr function returns one if the string returned by ansi contains the fire. substring. Then I restart the debugger, and a breakpoint is triggered on the required file. Let’s look at the stack to find out the address from where the call was made:
return to engine.CScriptManager::RunScript+88 from ???
Looks like a script start point! Time to open Engine. in IDA Pro.
Examining headers
IDA shows not very many incoming references to CreateFileA, and I quickly found a piece of code inside RunScript that reads the script file via the virtual file system (VFS).
v8 = __v.second.m_pManager->m_pFS->CreateMappedLoadObject(__v.second.m_pManager->m_pFS, pszScriptName);// (...)ScriptDataPtr = Script_2->GetMemoryPointer(Script_2);CScript::CScript(ScriptDataPtr, __v.second.__vftable, v43)The script body is passed to the constructor of the CScript object. IDA’s capacity with regards to programs written in C++ is very limited; so, CScript:: is just a function name with no direct links to its class. Many classes have virtual function tables that can be used to identify the class of a given function (even if you don’t have symbols at hand).
void __userpurge CScript::CScript(CScript *this@<ecx>, CScript *pScript, unsigned int ulSize);According to the function prototype, the first argument is a script file, and it also acts as the class instance body. Such a solution can often be found in old games. Their developers tried to save on serialization and simply dumped class bodies to disk (e.g. to create savegame files). Let’s look at the definition of the CScript class:
struct __cppobj __unaligned __declspec(align(4)) CScript{ unsigned int m_ulGlobalVarCount; boost::scoped_array<unsigned char> m_pGlobalVarTypes; _STL::map<CEString,unsigned long,_STL::less<CEString>,_STL::allocator<_STL::pair<CEString const ,unsigned long> > > m_Properties; unsigned int m_ulDataPoolSize; boost::scoped_array<char> m_pDataPool; unsigned int m_ulGlobalCount; boost::scoped_array<CScript::GLOBAL_FUNCTION> m_pGlobals; unsigned int m_ulTaskCount; boost::scoped_array<CScript::TASK> m_pTasks; _STL::map<unsigned long,CScript::EVENT,_STL::less<unsigned long>,_STL::allocator<_STL::pair<unsigned long const ,CScript::EVENT> > > m_GlobalEvents; unsigned int m_ulCodeSize; boost::scoped_array<boost::scoped_ptr<IInstruction> > m_pCode; unsigned int m_ulRunTask; unsigned int m_ulRunOp; _STL::set<IScriptNotify *,_STL::less<IScriptNotify *>,_STL::allocator<IScriptNotify *> > m_Notify[3];};The structure was read from the PDB file. IDA can’t handle templates properly, and these scary long strings with multiple commas and angle brackets are nothing more than names of C++ structures. The class body is similar to the script structure described on the fan site. It can be used in further analysis.
The first four bytes represent the m_ulGlobalVarCount field followed by the m_pGlobalVarTypes byte array. Next comes boost::. After it is the std:: dictionary. It’s not clear from the definitions what bytes represent them in the class body. The easiest way is to record values of each field for any known file in the debugger. One way or another, all these fields should be reduced to simple C structures in the class dump.
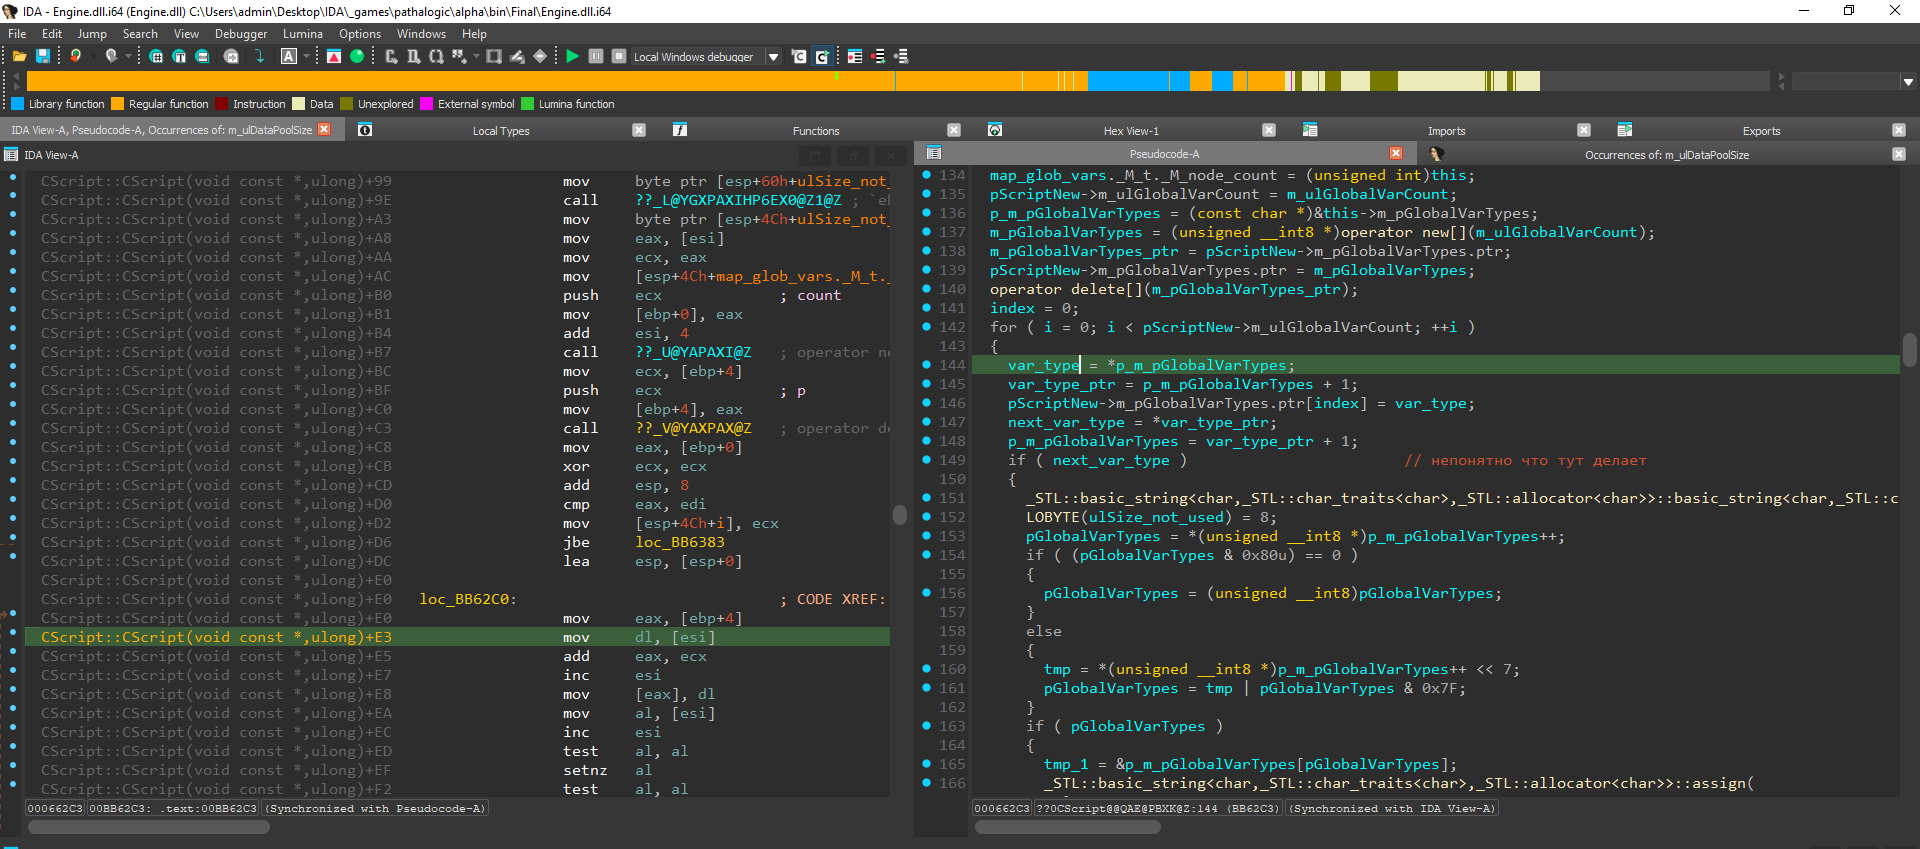
For this purpose, I enable in IDA addressing relative to the function beginning, and then enable synchronization between the assembler and pseudocode windows. Now you can find a specified address in any running debugger by entering the string CScript:: and view real values of the fields in dynamics.
qmemcpy(task->m_pVarTypes.ptr, var_count_ptr + 1, task->m_ulVarCount);Calls to functions belonging to the qmemcpy type are very helpful: the source data are stored in the ESI register; while the number of bytes to be copied, in ECX. This makes it possible to understand where a long string (not a field of the int type!) is supposed to be located in the file.
Some fields (e.g. m_ulGlobalVarCount) can be null, which means that the structure you are interested in doesn’t follow them. To detect interaction with files that contain this structure, conditional breakpoints like EAX ! can be used.
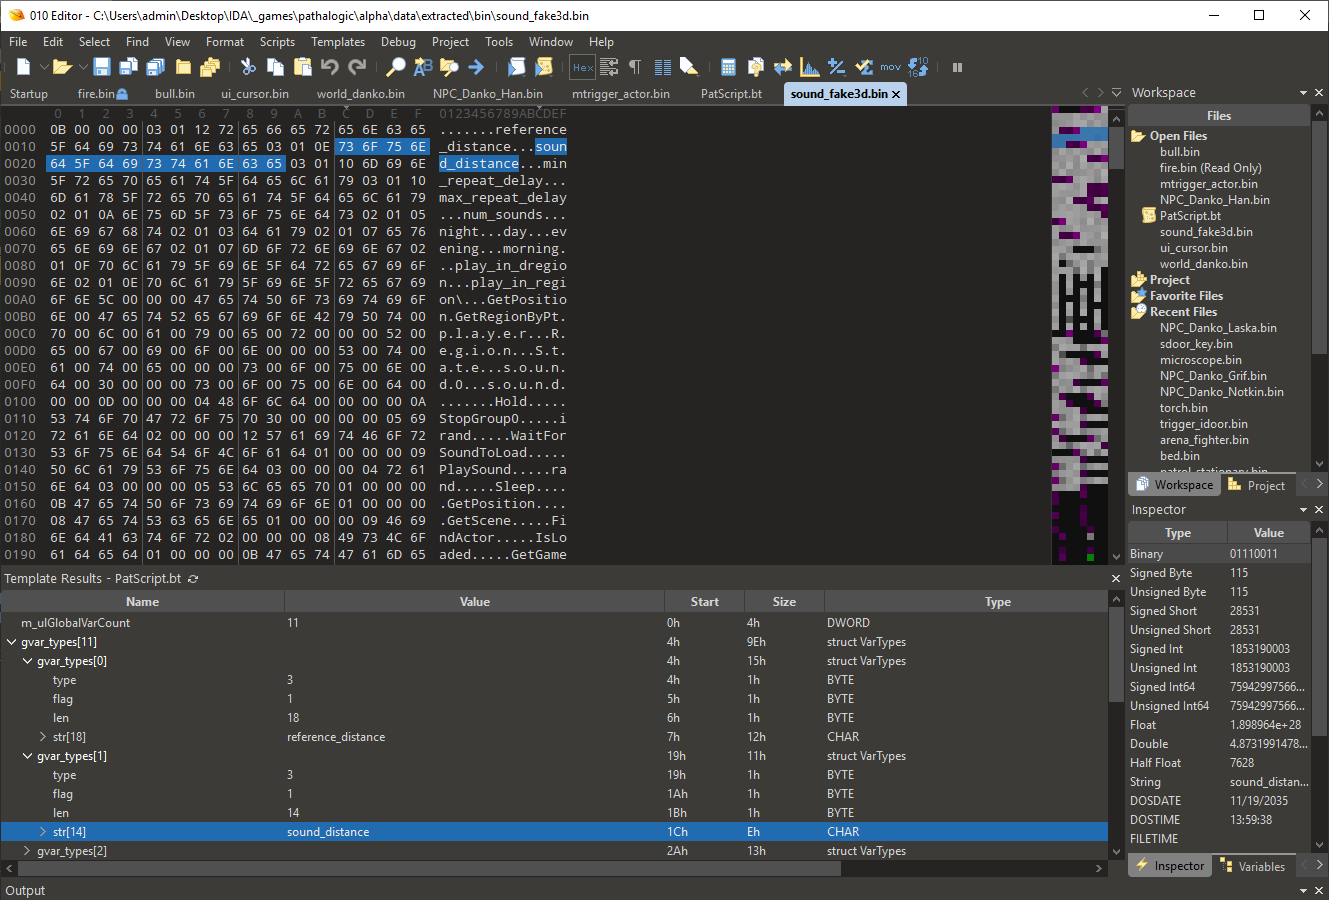
Using this technique, I restored file headers in 010 Editor. The procedure is simple: you make a guess, reflect it in the template, and check the values in the debugger. Then repeat until the picture comes together. The restored template is too large to list it here; it’s available in my repository on GitHub. Below is a simplified version:
struct VarTypes{ VAR_TYPE type; BYTE flag; BYTE len; CHAR str[len];};struct GLOBAL_FUNCTION{ BYTE Len; CHAR Name[Len]; DWORD ArgCount;};struct EVENT{ DWORD ulEventID; DWORD m_ulOp; DWORD m_ulVarCount; CHAR m_pVarTypes[m_ulVarCount];};struct TASK{ DWORD m_ulVarCount; BYTE m_pVarTypes[m_ulVarCount]; DWORD m_ulParmCount; DWORD event_count; EVENT m_Events[event_count];};struct EventId{ DWORD event_id; DWORD m_ulOp; DWORD m_ulVarCount; BYTE m_pVarTypes[m_ulVarCount];};struct Headers{ DWORD m_ulGlobalVarCount; VarTypes gvar_types[m_ulGlobalVarCount]; DWORD m_ulDataPoolSize; BYTE m_pDataPool[m_ulDataPoolSize]; DWORD m_ulGlobalCount; GLOBAL_FUNCTION m_pGlobals[m_ulGlobalCount]; DWORD m_ulRunTask; DWORD m_ulRunOp; DWORD m_ulTaskCount; TASK m_pTasks[m_ulTaskCount]; DWORD event_count; EventId Events[event_count]; DWORD m_ulCodeSize; BYTE code[m_ulCodeSize];};The file begins with defining global variables. Next comes the ‘pool’ consisting of strings in Unicode format. It’s followed by definitions of the functions used (in fact, this is the import section). The field m_ulRunOp specifies the command used to run the script. Tasks and events serve the same purpose. The headers end with an array of instructions, which is great: the file format analysis was actually performed to get them!
Examining bytecode
I decided to look at other methods of the CScript class and came across the following function:
void __usercall CScript::CreateInstruction(unsigned int ulType@<edi>, CStringReader *reader@<ecx>, CScript *pScript);After setting a breakpoint on it, I discovered that the ulType argument takes an opcode number; while the reader object refers to the current position in the read fire. file. To find out where the numbers are and where the arguments are, I decided to collect numbers using a conditional breakpoint:
Log text: ulType: {EDI}
Log condition: 1
The following list appears in the log:
ulType: 1A
ulType: 4E
ulType: 51
ulType: 1A
ulType: 4E
ulType: 17
ulType: 17
ulType: 4D
Finding these numbers in the file body:
00F0  00 51 00 00 00 00 00 1A 00 00 00 00 00 4E 00 00  .Q...........N..
0100  00 00 00 51 00 01 00 00 00 1A 00 00 00 00 00 4E  ...Q...........N
0110  00 00 00 00 00 17 00 02 00 00 00 05 05 17 00 01  ................
0120  00 00 00 01 4D 00 2C 00 00 00 1A 00 00 00 00 00  ....M.,.........
The opcode number comes first followed by arguments of variable length. So, I have no choice but to examine each number separately and produce a map.
void __usercall CScript::CreateInstruction(unsigned int ulType@<edi>, CStringReader *reader@<ecx>, CScript *pScript){ // (...) switch ( ulType ) { case 0u: v4 = operator new(0xCu); if ( !v4 ) goto LABEL_4; CInstructionMov::CInstructionMov(v4, reader); return result; case 1u: v6 = operator new(0xCu); if ( !v6 ) goto LABEL_4; CInstructionMovB::CInstructionMovB(v6, reader); return result; case 2u: v7 = operator new(0xCu); if ( !v7 ) goto LABEL_4; CInstructionMovI::CInstructionMovI(v7, reader); return result; // (...) }}Inside the CreateInstruction function, there is a huge switch with handlers for each number. The first objective is to write a length disassembler. It’s not really important how the opcode works; what’s important is how much space it takes up in the file. Then you can read the rest of the stuff correctly.
void __usercall CInstructionMov::CInstructionMov(CInstructionMov *this@<eax>, CStringReader *reader@<edx>){ const char *m_pszDataCur; // ecx this->__vftable = &CInstructionMov::vftable; m_pszDataCur = reader->m_pszDataCur; this->m_ulVarIn = *m_pszDataCur; m_pszDataCur += 4; reader->m_pszDataCur = m_pszDataCur; this->m_ulVarOut = *m_pszDataCur; reader->m_pszDataCur = m_pszDataCur + 4;}So, how much space does it take? The class body can be used as a hint:
struct __cppobj CInstructionMov : IInstruction{ unsigned int m_ulVarIn; unsigned int m_ulVarOut;};Inheritance of the IInstruction interface ensures that the first four bytes act as a reference to vftable. Then go two fields: m_ulVarIn and m_ulVarOut. Looking at the code, you can see that the cursor of the reader object is shifted twice by four bytes, which exactly corresponds to the two fields in the class body. This means that eight bytes are read. Let’s create the same structure in the template:
struct CInstructionMov{ DWORD VarIn; DWORD ulVarOut;};CreateInstruction processes 87 opcodes, and a few liters of coffee later, I managed to examine them all. All that remained was to compare opcode numbers in the template with the list of intercepted numbers in the debugger. After a while, I identified and fixed the errors, and my template became applicable to all scripts.
Parsing the code without errors is half the battle. The next step is to understand what it does.
Writing decompiler
I already have a list of opcodes whose names indicate what they do. But in the ideal case, I need readable pseudocode clearly showing what the script does. Following the logic of object-oriented programming, an opcode object should contain the execution code that is called when the script is executed. And indeed, searches by name bring the Execute method belonging to the class with the same name:
bool __thiscall CInstructionMov::Execute(CInstructionMov *this, CScriptRun::Data *data, float fDeltaTime){ _BYTE pExceptionObject[12]; // [esp+8h] [ebp-Ch] BYREF if ( !(*data->m_Stack._M_finish[-this->m_ulVarOut].m_Object->vSet)( data->m_Stack._M_finish[-this->m_ulVarOut].m_Object, data->m_Stack._M_finish[-this->m_ulVarIn].m_Object) ) { CScriptRun::Error::Error("Can't convert variable"); _CxxThrowException(pExceptionObject, &_TI1_AVError_CScriptRun__); } ++data->m_ulCurOp; return 0;}As you can see, the code increments the global instruction counter m_ulCurOp, a local analogue of the EIP register.
struct IVariableEx_vtbl{ void (__thiscall *~IBase)(IBase *this); bool (__thiscall *Release)(IGeneric *this); IGeneric *(__thiscall *QueryInterface)(IGeneric *this, unsigned int); VAR_TYPE (__thiscall *GetVariableType)(IVariable *this); _BYTE vSet[24]; bool (__thiscall *Set)(IVariable *this, bool); _BYTE vGet[24]; bool (__thiscall *Get)(IVariable *this, bool *); // (...)};Logically, the Set method should be called, but in reality, bytes at the address that I dubbed vSet are ‘called’. The point is that IVariableEx is an interface, and its specific implementation depends on the variable type. 24 bytes are left for six references to six different types of variables. The general interface leaves space for a specific reference, but doesn’t know its exact location. So, this can be considered a call to the Set method. The code uses it to pass the value of the m_ulVarIn variable to the m_ulVarOut variable. In pseudocode, this can be represented as follows:
Stack[-VarOut] = Stack[-VarIn]
The m_Stack object represents std::, a dimensionless array from a standard C++ library. It implements the stack of the virtual machine written in a makeshift scripting language. This stack operates on the LIFO (Last In, First Out) principle (i.e. adds the last element to the end of the list and takes the next element from the end). This is why the code uses negative numbers: they represent negative indices from the end of the list.
I decided to write my decompiler in Python since this language is perfectly suited for binary parsers. First, I had to create my own reader class to read the byte stream in a convenient way:
class Reader: def __init__(self, path): self.f = open(path, "rb") def __del__(self): self.f.close() def read(self, size, format): return struct.unpack(format, self.f.read(size))[0] def uint32(self): return self.read(4, 'I') def uint16(self): return self.read(2, 'H') def uint8(self): return self.read(1, 'B') def bytes(self, size): return self.f.read(size) def str_a(self, size): return self.f.read(size).decode('utf-8') def float(self): return round(struct.unpack('f', self.f.read(4))[0], 5)Thanks to this class, adding a new opcode became a very simple operation, and the code is easy to read:
class CInstructionMov: def __init__(self, r): self.OpCode = 'Mov' self.VarIn = r.uint32() self.VarOut = r.uint32() def __repr__(self): return f'Stack[-{self.VarOut}] = Stack[-{self.VarIn}]'In the code produced by IDA, it’s not always clear what a complex instruction does. The easiest way is to check the state of the stack (where all variables are stored) before and after the instruction is executed. To do this, I had to write another script for the debugger (but this time for IDA Pro).
When you fall inside an instruction like CInstructionMov, the second argument is CScriptRun::: a reference to a structure with global variables. Let’s read it:
struct __cppobj CScriptRun::Data{ CScript *m_pScript; CScriptRun *m_pScriptRun; IScriptContext *m_pContext; CScriptRun::GF_RESOLVED *m_pResolved; boost::scoped_array m_pGlobalVars; _STL::vector m_Tasks; _STL::vector m_Stack; unsigned int m_ulCurOp; CSerPtr m_pOpData;};IDAPython makes it possible to read register and memory values during debugging:
def dump_vm_state(): data_ptr = get_reg_value('esp') + 4 data_adr = read_dbg_dword(data_ptr) stack_ptr = data_adr + 0x20 cur_op = read_dbg_dword(data_adr + 0x2c) print(f'CurOP: {hex(cur_op)}') print(f'Stack: ') dump_vector(stack_ptr)I take a reference from the stack and unwind it to the required structures located at known offsets:
def dump_vector(addr): m_start = idc.read_dbg_dword(addr) m_finish = idc.read_dbg_dword(addr+4) while m_start < m_finish: m_obj = idc.read_dbg_dword(m_start) vftable = idc.read_dbg_dword(m_obj) class_name = idc.get_name(vftable) demangle_type = idc.get_inf_attr(INF_SHORT_DN) class_name = idc.demangle_name(class_name, demangle_type) class_name = RE_VAR_TYPE.findall(class_name)[0] value = '' if class_name == 'CVariableInt': value = idc.read_dbg_dword(m_obj+8) if class_name == 'CVariableFloat': value = idc.read_dbg_dword(m_obj+8) if class_name == 'CVariableString': vector = idc.read_dbg_dword(m_obj+8) str_data = read_dbg_memory(vector, 100) value = '"' + get_str_from_addr(str_data) + '"' if class_name == 'CVariableBool': value = idc.read_dbg_byte(m_obj+8) if class_name == 'CVariableVector': x = idc.read_dbg_dword(m_obj+8) y = idc.read_dbg_dword(m_obj+8+4) z = idc.read_dbg_dword(m_obj+8+4+4) value = f'({x},{y},{z})' print(hex(m_start), hex(m_obj), class_name, value) m_start +=4An interesting trick is used here. The stack contains references to objects: classes derived from CVariableBase. The first four bytes in the body of any object represent a reference to vftable. Its address can be used to get the class name provided by debugging symbols. And if you know the class of a variable, you can easily read its values:
Python>dump_vm_state()
CurOP: 0x1015
Stack:
0x3dcd1f8 0x3dcda38 CVariableFloat 0
0x3dcd1fc 0x3dcda60 CVariableFloat 1086324736
0x3dcd200 0x3dcda88 CVariableString “dawn_bk.tex”
0x3dcd204 0x3dcdab8 CVariableString “dawn_ft.tex”
0x3dcd208 0x3dcdae8 CVariableString “dawn_lt.tex”
0x3dcd20c 0x3dcdb18 CVariableString “dawn_rt.tex”
0x3dcd210 0x3dcdb48 CVariableString “dawn_up.tex”
0x3dcd214 0x3dcdb78 CVariableString “dawn_rain_bk.tex”
0x3dcd218 0x3dcdba8 CVariableString “dawn_rain_ft.tex”
0x3dcd21c 0x3dcdd50 CVariableString “dawn_rain_lt.tex”
0x3dcd220 0x3dcdd80 CVariableString “dawn_rain_rt.tex”
0x3dcd224 0x3dcddb0 CVariableString “dawn_rain_up.tex”
0x3dcd228 0x3dcdde0 CVariableBool 3131961344
0x3dcd22c 0x3dcde08 CVariableVector (1053345994,1048872069,1048872069)
0x3dcd230 0x3dcde38 CVariableVector (1053345994,1048872069,1048872069)
0x3dcd234 0x3dcde68 CVariableFloat 1161527296
0x3dcd238 0x3dcde90 CVariableFloat 1167867904
0x3dcd23c 0x3dcdeb8 CVariableVector (1061734602,1057326470,1055056611)
0x3dcd240 0x3dcdee8 CVariableVector (1061734602,1057326470,1055056611)
0x3dcd244 0x3dcdf18 CVariableFloat 0
0x3dcd248 0x3dcdf40 CVariableFloat 1090519040
0x3dcd24c 0x3dcdf68 CVariableFloat 1086324736
By dumping values before and after the instruction is executed, I managed to parse the opcodes without digging through tons of C++ code decompiled with errors. Of course, if an instruction behaved unexpectedly, I had to look into the decompiler, but most instructions were parsed without any hassle.
All I had to do was parse the code of the remaining 86 opcodes in a similar way. About a week later, I got an operational decompiler. If I try to describe each opcode separately, this article would turn into a book. The full decompiler code is available on GitHub.
Migrating from the alpha version
The alpha version stores in its archive 343 scripts dated July 2004. The official release of “Pathologic” contains 978 scripts dated up to October 2005.
I am interested in scripts of the full version, but when I try to open them using the 010 Editor template created for the alpha version, a template engine error occurs. The headers are parsed properly, which means that their format hasn’t changed, but the list of opcodes breaks the template execution. To find out what’s the matter, I have no choice but to compare both engines.
To do this, a plugin for IDA Pro called Diaphora is required. It’s designed to compare two versions of the same file. The patch diffing technique makes it possible to find the place fixed by a security patch and write an exploit for the old version. The same method can be used to determine the location of known functions to understand what has changed in the new version of the engine.
IDA is renowned for its backward compatibility with its old versions; so, at the end of my research, the plugin crashed with an error.
[Traceback (File self.File self.File local_types File return AttributeError:
OK, I’m examining the source code of the file C:\ (since I remember that the function should be there) and expectedly don’t find it there. Then I’m examining the code of the old version:
def get_ordinal_qty(): """ Get number of local types + 1 @return: value >= 1. 1 means that there are no local types. """ return ida_typeinf.get_ordinal_qty(None)IDA developers like to change the names of functions while leaving old comments to them. I search the text for a copy of the comment and find the new name:
def get_ordinal_limit(): """ Get number of local types + 1 @return: value >= 1. 1 means that there are no local types. """ return ida_typeinf.get_ordinal_limit(None)I make changes in the Diaphora code and restart the plugin. This time everything goes well. The plugin creates a SQLite database for both files and then compares them to find similar functions. At the output, I get several new windows displaying lists of similar functions. Then I take a snapshot of the database and click “Import all functions”.

Now I have an almost completely labeled database for the new version of the engine. But I still have to find changes in the code of the CreateInstruction function. I compare all its instructions one by one until I stumble upon the first differences:
case 0x4C: v73 = operator new(0x14u); if ( v73 ) CInstructionPow2::CInstructionPow2(v73, a1); return;case 0x4D: v76 = operator new(0xCu); if ( v76 ) CInstructionCall::vftable(v76, a1); return;case 0x4E: if ( operator new(0x10u) ) NEW_OCPODE_1(a1); return;case 0x4F: v19 = operator new(8u); if ( !v19 ) return; *v19 = &NEW_COMMAND_2_vtable; break;Two new opcodes were added close to the end of the list! The first one takes up nine bytes and does nothing useful. But the second one transfers control and essentially repeats the CInstructionCall code (so I named it Call2 in the decompiler). The remaining opcodes operate the same as before.
Examining existing scripts
The decompiler is ready, and it works. Sometimes, the decompilation isn’t very accurate, but you still can understand what this or that script does. To prevent opcodes from merging into a single array of text, I decided to separate them into typical basic blocks by adding line breaks after control transfer instructions.
bed.bin
This script is responsible for the behavior of beds in the game.
Import:
    SetVisibility (1 args)
    Hold (0 args)
    IsOverrideActive (1 args)
    ActivateSleepMode (1 args)
RunOp = 0x0
RunTask = 0
GlobalTasks:
    GTASK_0  Params = 0
        EVENT_0 Op = 0x7 Vars = (object)
0x0: Push((bool) 1)
0x1: @ SetVisibility(Stack[-1])
0x2: Pop(1)
0x3: @ Hold()
0x4: Pop(0)
0x5: GOTO 0x3
0x6: Return(0)
0x7: PushEmpty(bool, bool)
0x8: @ IsOverrideActive(Stack[-1])
0x9: Pop(0)
0xa: Stack[-1] = !Stack[-1]
0xb: IF (Stack[-1] == 0) GOTO 0xe; Pop(1)
0xc: @ ActivateSleepMode(Stack[-3])
0xd: Pop(0)
0xe: Return(2)
When an object is created (i.e. when the player appears in the immediate vicinity), the code at the address RunOp is executed. The addresses represent ordinal numbers of opcodes (similar to line numbers in BASIC). The first (i.e. null) opcode passes the value 1 onto the stack. The second one calls the SetVisibility function with a single argument that is taken from the top of the stack. Then an infinite loop consisting of the Hold function calls starts.
The GlobalTasks header contains event addresses (something like callbacks that are called in response to certain events in the game). As far as I understand, the only ‘event’ in the life of a bed object is a situation when the player presses the action button. The code begins at offset 0x7 and executes the ActivateSleepMode function (i.e. opens the sleep time selection menu).
item_milk.bin
Below is the milk object code:
Strings:
    drink
    hunger
    add
Import:
    PlaySound (1 args)
    HasProperty (2 args)
    GetProperty (2 args)
    SetProperty (2 args)
    CreateFloatVector (1 args)
    SendWorldWndMessage (2 args)
RunOp = 0x0
RunTask = 0
The list of commands is too long to quote, and I just provide a possible execution path:
0x0: Push("drink")
0x1: @ PlaySound(Stack[-1])
0x2: Pop(1)
0x3: PushEmpty(bool, string, float, float, float)
0x4: Stack[-4] = "hunger"
0x5: Stack[-3] = (float) -0.07
0x6: Stack[-2] = (int) 0
0x7: Stack[-1] = (int) 1
0x8: Call2 0xf
0xf: PushEmpty(bool, float, bool, float)
0x10: @ HasProperty(Stack[-8], Stack[-2])
0x11: Pop(0)
0x12: Stack[-2] = !Stack[-2]
0x13: IF (Stack[-1] == 0) GOTO 0x16; Pop(1)
0x16: @ GetProperty(Stack[-8], Stack[-1])
0x17: Pop(0)
0x18: PushEmpty(float, float, float, float)
0x19: Stack[-3] = Stack[-5] + Stack[-11]
0x1a: Stack[-2] = Stack[-10]
0x1b: Stack[-1] = Stack[-9]
0x1c: Call2 0x22
0x22: PushEmpty()
0x23: Pop(0); Push((bool) Stack[-3] < Stack[-2])
0x24: IF (Stack[-1] == 0) GOTO 0x27; Pop(1)
0x25: Stack[-4] = Stack[-2]
0x26: Return(0)
0x1d: Pop(3)
0x1e: @ SetProperty(Stack[-9], Stack[-1])
0x1f: Pop(1)
0x20: Stack[-9] = (bool) 1
0x21: Return(4)
At the beginning of the script, the drink sound is played using the PlaySound function. Then the value of the hunger attribute is checked, and if hunger exists, 0.07 is subtracted from it. Now you know how a bottle of milk works. And, as you can see, the decompiler operates without errors.
Existing Mods
First, I decided to check existing modifications for “Pathologic”. It turned out that most noteworthy mods are based on Rat Fog Editor. Some madman has methodically edited all bytes in the weather. script to identify a pattern in game’s reactions to changes.
0x3: Pop(0)
0x4: Push("night_bk.tex")
0x5: Push("night_ft.tex")
0x6: Push("night_lt.tex")
0x7: Push("night_rt.tex")
0x8: Push("night_up.tex")
0x9: Push("night_rain_bk.tex")
0xa: Push("night_rain_ft.tex")
0xb: Push("night_rain_lt.tex")
0xc: Push("night_rain_rt.tex")
0xd: Push("night_rain_up.tex")
0xe: Push((bool) 0)
0xf: Push(CVector(0.0, 0.0, 0.0))
0x10: Push(CVector(0.27451, 0.27451, 0.27451))
0x11: Push((float)3000.0)
0x12: Push((float)5000.0)
0x13: Push(CVector(0.19608, 0.19608, 0.19608))
0x14: Push(CVector(0.19608, 0.19608, 0.19608))
0x15: @ ForceWeather(Stack[-17], Stack[-16], Stack[-15], Stack[-14], Stack[-13], Stack[-12], Stack[-11], Stack[-10], Stack[-9], Stack[-8], Stack[-7], Stack[-6], Stack[-5], Stack[-4], Stack[-3], Stack[-2], Stack[-1])
0x16: Pop(17)
Indeed, the script contains plenty of float values that are responsible for lighting, fog, and color correction.

The remaining decompiled scripts are available in my repository on GitHub; I assembled it using four different versions of the game.
Modding
The first thing that came to my mind was to change the contents of municipal urns. According to the game, the main function of an attending physician is to rummage through garbage. Let’s ease Bachelor Dankovsky’s burden by placing a cure in each urn. To do this, open the urna. script.
0x0: PushEmpty(float, float)
0x1: Push((bool) 1)
0x2: @ SetVisibility(Stack[-1])
0x3: Pop(1)
0x4: PushEmpty()
0x5: Call2 0x1a
0x1a: @ RemoveAllItems()
0x1b: Pop(0)
0x1c: PushEmpty(string, int, int, int)
0x1d: Stack[-4] = "bottle_empty"
0x1e: Stack[-3] = (int) 1
0x1f: Stack[-2] = (int) 2
0x20: Stack[-1] = (int) 2
0x21: Call2 0x38
0x38: PushEmpty(int, bool, int, bool)
0x39: PushEmpty(bool, int, int)
0x3a: Stack[-2] = Stack[-10]
0x3b: Stack[-1] = Stack[-9]
0x3c: Call2 0x47
0x47: PushEmpty(int, int)
0x48: @ irand(Stack[-1], Stack[-3])
0x49: Pop(0)
0x4a: Stack[-5] = (bool) Stack[-1] < Stack[-4]); Pop(1)
0x4b: Return(2)
0x3d: Pop(2)
0x3e: IF (Stack[-1] == 0) GOTO 0x46; Pop(1)
0x3f: @ irand(Stack[-2], Stack[-5])
0x40: Pop(0)
0x41: Push((int) 0)
0x42: Push((int) 1)
0x43: Stack[-4] += Stack[-1]
0x44: @ AddItem(Stack[-3], Stack[-10], Stack[-2], Stack[-1])
0x45: Pop(2)
0x46: Return(4)
The script calculates the probability of an item to appear in the urn, and if the player is lucky, then the bottle_empty object is added to the urn using the AddItem function. In another script, you can see the name powder; so, all you have to do is replace a single line in this script with another one.

Conclusions
The debug information published together with the game made it possible to reconstruct its code and create modifications for many games.

To create a fully-functional SDK, plenty of work is still required, but a start has been made. The decompiler is far from perfection, and not all commands are displayed correctly. The next step is to decompile game scripts into C-like code (like Hex-Rays).
Congrats! Today you’ve reverse-engineered software written in C++; while the “Pathologic” community got an operational (albeit still raw) modding tool.