
warning
This article is intended for security specialists operating under a contract; all information provided in it is for educational purposes only. Neither the author nor the Editorial Board can be held liable for any damages caused by improper usage of this publication. Distribution of malware, disruption of systems, and violation of secrecy of correspondence are prosecuted by law.
Everything new is actually well-forgotten old. You might remember my old article How to fool MSI installer: Instructions for lazy hackers that analyzed installation scripts used in the InstallShield package. Analysis of installation scripts is the easiest way to patch a program that refuses to install: it doesn’t require you to parse and debug its virtual machine. Too bad, it’s applicable only to most simple cases (it’s like patching an EXE file using only WinHex (i.e. without a debugger and a disassembler) or fixing a computer with a single flat-bladed screwdriver).
Four years have passed; let’s continue dissecting InstallShield while it still holds relevance. Imagine that you have an application whose installer requests user data and a serial number in the course of installation.
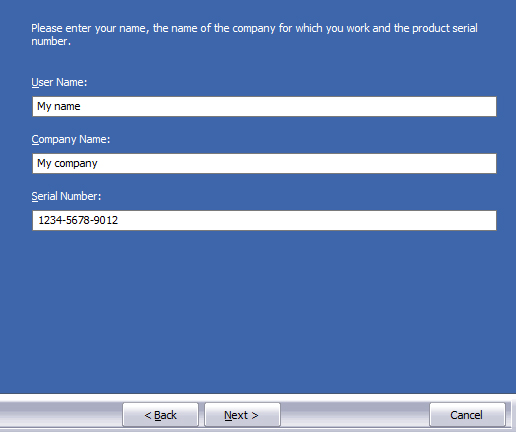
If you enter an incorrect serial number, the installer displays a warning and refuses to continue. Accordingly, you have to figure out how it validates the entered code. This time, you don’t have to patch anything. First, because you are a bona fide hacker researcher who pursues purely educational purposes and isn’t interested in the final result, but only in the process. Second, the patching process has already been discussed in the above-mentioned article, which I strongly recommend to read for a better understanding of what I’m going to demonstrate today. However, for those who are lazy and impatient, I will try to explain everything in the simplest way.
To avoid duplicating information from the previous article, let’s omit such stages as searching for, extracting, and decompiling the installation script setup. (in this particular case, the files setup., data1., data1., and others are located in an explicit form near to the setup. installer). To unscramble and decompile this script, I suggest to use the isDcc31. utility: this is a newer analogue of isDcc described in the previous article. The utility is available, for example, in the latest version of the UniExtract package. By the way, this tool (or, to be specific, the IsXunpack. utility included in it) can be used to unpack and examine installation cab archives. But for now, you are interested in the installation script setup.. To unscramble it, use the following command:
isdcc31.exe -u setup.inx
Then decompile it:
isdcc31.exe setup.inx.dec >setup.dec
At this point, the preliminary phase ends, and the research process begins. You’ve got about a megabyte of text code that doesn’t contain any variable/procedure names or text strings that could somehow clarify the serial number validation procedure. Accordingly, there’s no way to cut corners as it was in the previous case; and you have no choice but to start the debugger and disassemble the InstallShield virtual machine.
Let’s use the standard procedure. When the installer displays the window used to enter the serial number and user data, you attach the x64dbg debugger to the setup. process. First of all, you have to check the most obvious hypothesis: the threaded code of the virtual machine is currently stored in the process memory. If so, you could set a breakpoint on the access to some known section of this code in order to track it from the virtual machine side.
Unfortunately, searches in memory don’t yield any result, which suggests that the threaded code isn’t interpreted directly, but is somehow processed during loading (maybe even JIT compilation is performed as in the cases of IL or JVM). Of course, such an annoying obstacle won’t stop a true hacker researcher; so, let’s try to solve the problem from the WinAPI side.
Reasonably assuming that the function user32. is normally used to read text from the input field, you set a breakpoint on it and click “Next”. This is a very common function, and you have to skip a dozen irrelevant system calls from various event handlers until you stumble upon the place where direct access from InstallShield occurs; its call stack looks as follows.
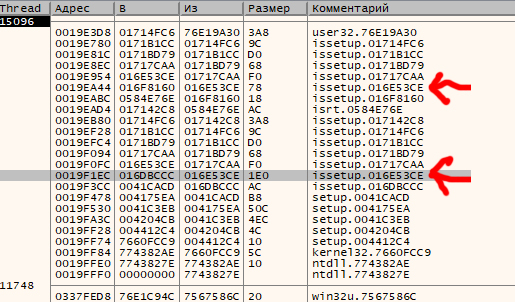
I have no doubt that your well-trained eye immediately recognizes a recursive call of virtual machine subroutines (repeating patterns in the stack are marked by arrows). In addition, it becomes clear which library contains this virtual machine: the issetup. module. In this particular case, it’s stored in the directory next to setup.. The developers have packed it using PECompact; so, you don’t even search for an unpacker, but simply dump it using Scylla and feed the dumped data to the IDA disassembler.
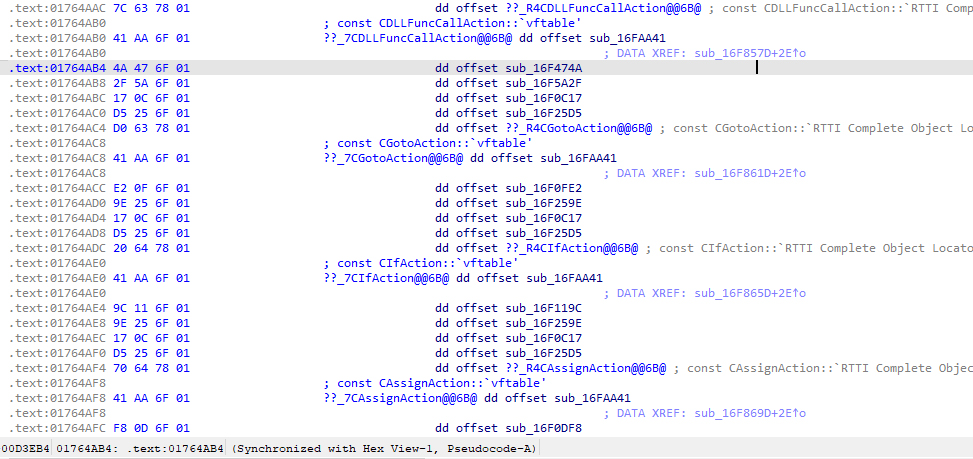
Time to examine the call stack based on the issetup. code restored in IDA. On the second call from the top, you make an interesting discovery: user32. is directly called from a function, and the reference to this function is located in a vftable that looks as shown below.
To understand this table, you have to analyze the command system in the threaded code of the installation script interpreter. In the previous article, I limited my efforts to empirically finding the 0xD (equivalence comparison) and 0xE (inequality comparison) opcodes. This time, let’s delve deeper and analyze the entire command system.
For this purpose, you’ll need a tool that can decompile INX into source code. You can use the source code of isDcc from GitHub, but, in my opinion, it’s much better to use another tool called InstallScript Decompiler: it not only decompiles, but also disassembles INX code. On the other hand, isDcc is better suited for script decompiling since InstallScript Decompiler is marred by bugs…
You examine the InstallScript Decompiler code and find the Action module containing a list of interpreter commands (that are called Actions) and their opcodes. Their number isn’t large; so, I provide the entire list here:
| Opcode | Description |
|---|---|
| 1 | CNOPAction |
| 2 | CAbortAction |
| 3 | CExitAction |
| 4 | CIfAction |
| 5 | CGotoAction |
| 6 | CAssignAction |
| 7 | BinAdd |
| 8 | BinMod |
| 9 | BinLT |
| 10 | BinGT |
| 11 | BinLTE |
| 12 | BinGTE |
| 13 | BinEq |
| 14 | BinNEq |
| 15 | BinSub |
| 16 | BinMul |
| 17 | BinDiv |
| 18 | BitAnd |
| 19 | BitOr |
| 20 | BitXor |
| 21 | ~ |
| 22 | BitShl |
| 23 | BitShr |
| 24 | LogAnd |
| 25 | LogOr |
| 26 | CAddressOfAction |
| 27 | * |
| 28 | CIndirectStructAction |
| 29 | CSetByteAction |
| 30 | CGetByteAction |
| 32 | CDLLFuncCallAction |
| 33 | CInternalFuncCallAction |
| 34 | CFuncPrologAction |
| 35 | CReturnAction |
| 36 | CReturnAction |
| 37 | CReturnAction |
| 38 | CEndFuncAction |
| 39 | CNOPAction |
| 40 | CStrLengthCharsAction |
| 41 | CStrSubAction |
| 42 | CStrFindAction |
| 43 | CStrCompareAction |
| 44 | CStrToNumAction |
| 45 | CNumToStrAction |
| 46 | CHandlerAction |
| 47 | CHandlerExAction |
| 48 | CDoHandlerAction |
| 49 | CResizeAction |
| 50 | CSizeofAction |
| 51 | CPropPutAction |
| 52 | CPropPutRefAction |
| 53 | CPropGetAction |
| 54 | CTryAction |
| 55 | CEndTryAction |
| 56 | CEndCatchAction |
| 57 | CUseDLLAction |
| 58 | CUnUseDLLAction |
| 59 | CBindVariableAction |
| 60 | CAddressOfWideAction |
The actions with opcodes 0xD (13) and 0xE (14) empirically identified in the previous article are BinEq and BinNEq, respectively, which is consistent with the earlier observations. Further examination of the decompiler source code gives a rough understanding of the threaded code structure in the installation script. Let’s analyze it using a function with a conventional name function0 as an example; its binary code is shown below.
The code of this function decompiled in isDcc31 looks as follows:
    function function0(pBool0)
    begin
Label0:
008142:0006:         pBool0 = 0;
00814E:0014:         lString0 = lString4 ^ "MANUALS\\setup.exe";
00816C:0021:         call function438(3,lString0);
00817A:0006:         lNumber0 = number0;
008184:000D:         lNumber0 = lNumber0 == 1;
008193:0004:         if lNumber0 == false then goto label1 ;
00819F:0006:         pBool0 = 1;
Label1:
0081AD:0024:         return;
0081BB:0026:         end;
    end;
For better understanding, below is its code ‘disassembled’ using InstallScript Decompiler, but, as said earlier, this disassembler is very ‘specific’:
8137: v {CNumArg} -101 = 0
8137: v {CStrArg} -101 = v {CStrArg} 4 13 "MANUALS\setup.exe"
8137: Func_1107(3, v {CStrArg} -101)
8137: v {CNumArg} -102 = v {CVariantArg} 0
8137: v {CNumArg} -102 = v {CNumArg} -102 7 1
8137: If (else:1) v {CNumArg} -102
8137: v {CNumArg} -101 = 1
81ab: RETURN
81ab: EndFuncAction
The function starts at offset 0x8137, but the first directly executed action is located at offset 0x8142. For some reason, the CFuncPrologAction action before it (opcode 0x22, offset 0x8139) is ignored by the decompiler (probably due to the lack of informational value).
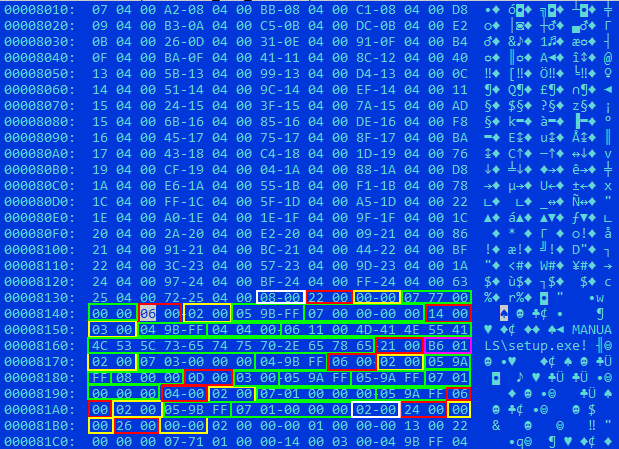
The chosen function is the simplest one; it consists of only ten actions, and their structure is approximately the same. The first two bytes represent the opcode (the red frame). The first command, as said above, is CFuncPrologAction (0x22), the second one is CAssignAction (6), the third one is BitXor (0x14; in the case of string parameters, this action is used for string concatenation), the fourth one is CInternalFuncCallAction (0x21), and so on.
The two subsequent bytes usually represent the action’s parameter counter (the yellow frame). In this example, the only exceptions are the actions CFuncPrologAction (for some reason, its counter is set to zero, although it has one parameter: a numeric constant of the function code block size in bytes) and CInternalFuncCallAction where the next two bytes represent the internal function number (483=0x1B6, the purple frame) followed by the parameter counter.
The parameter counter, in turn, is followed by the list of action parameters (the green frame). The first byte of each parameter defines its type; depending on it, the parameter length is determined. For example, CNumArg, a numeric constant of type 7 (the only parameter in CFuncPrologAction, the third parameter in CAssignAction, and so on) implies that it must be followed by 32-bit data. CStrArg, a string constant of type 6, used, for example, as the third parameter in BitXor, contains a string with a 16-bit counter immediately after the parameter type. Parameters of types 4 and 5 point to variables that are identified by a signed 16-bit identifier: negative values are external to this function (apparently due to their position in the internal stack); while positive values are passed as parameters.
But the most original feature is interaction with labels of conditional and unconditional jumps. Normally, threaded code interpreters use the following concept: the parameter of a jump instruction is the offset in bytes or commands relative to this instruction; in case of a jump, the instruction counter should be shifted by this offset. In this case, everything is totally different: all functions are divided into blocks of actions (apparently, to simplify the threaded code compilation). This function consists of two blocks and begins with the size of the first code block in actions (8 at offset 0x8142, the white frame).
The next block begins at offset 0x81AB and consists of two actions. In jump instructions, block’s ordinal number relative to the block containing the current jump instruction (in the form of a 32-bit constant of the CNumArg type) is used as the address. For example, 0 is used to jump to the beginning of the current block; 1 is used to jump to the beginning of the next block; and –1 (or 0xFFFFFFFF) is used to jump to the beginning of the previous block. In other words, the construct at offset 0x8193 that was awkwardly decompiled as if (or even more dumbly as If (), is just a call to the CIfAction action that checks whether the 0xFF9A variable is true, and if the check fails, it jumps to the next block 0x81AD.
At this point, let’s stop examining specific features of the threaded code and get back to the subject. Now that you have an understanding of the threaded code structure, it will be much easier to deal with the native code. You have explicitly identified virtual function tables for each action of the interpreter embedded into the installation script, and the address of the function executed during the code interpretation is located at offset 4 from the beginning of each action (red frames in the screenshot below).
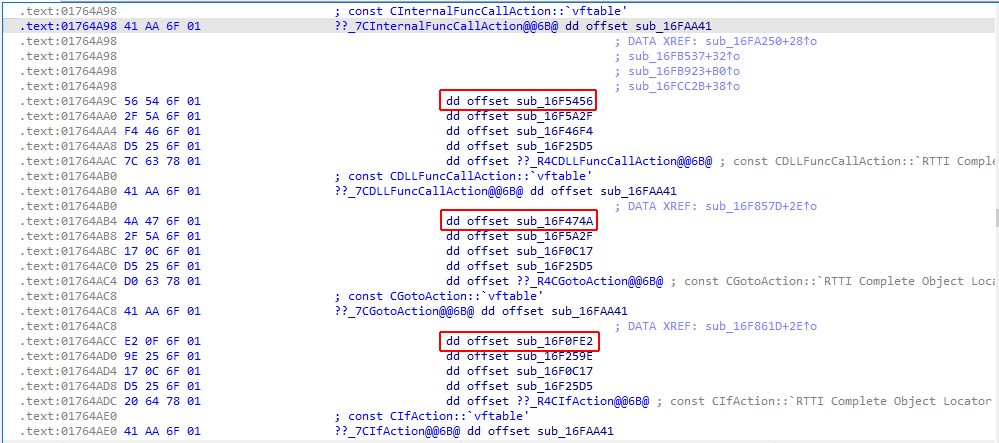
In addition, you’ve found the interpreter itself: it consequently executes actions when interpreting a script (in the screenshot below, the call to the handler function is highlighted).
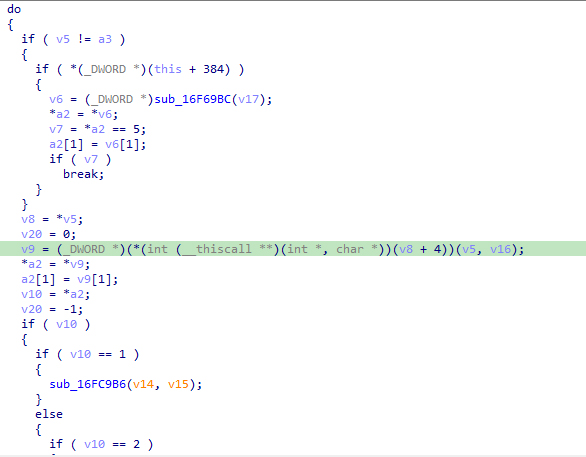
Too bad, as it could be expected, at the time of interpretation, the threaded code is already slightly compiled into the object table, and there is no access to the source code. In addition, the absence of function and variable names in the code necessitates the need to somehow bind the debugger to the decompiled script code.
The first idea that comes to mind is to set conditional breakpoints with logging on calls to handlers of each action (fortunately, there are only a few dozen of them). This way, you will at least get an execution trace of certain script sections that can be compared with the decompiled code (although it’s not an easy task). In addition, it’s possible to log not all instructions, but only certain groups of them that are required at the moment. For example, in this particular case, it’s necessary to track manipulations with the entered string — so, you can set breakpoints on actions that interact with strings: CStrLengthCharsAction, CStrSubAction, CStrFindAction, CStrCompareAction, etc. As a result, you’ll get the following trace:
...
StrSub L"<IFX_PRODUCT_DISPLAY_NAME>"
StrSub L"IFX_PRODUCT_DISPLAY_NAME"
Strlen L"%P"
Strlen L"Please enter your name, the name of the company for which you work and the product serial number."
StrSub L"<IFX_PRODUCT_DISPLAY_VERSION>"
StrSub L"IFX_PRODUCT_DISPLAY_VERSION"
Strlen L"%VS"
Strlen L"19.03.000"
Strlen L"Please enter your name, the name of the company for which you work and the product serial number."
Strlen L"<IFX_INSTALLED_DISPLAY_VERSION>"
StrSub L"<IFX_INSTALLED_DISPLAY_VERSION>"
...
This significantly simplifies the analysis of actions with strings performed by the script. To track situations when strings are passed to some external libraries, let’s set a breakpoint with logging on the CDLLFuncCallAction action.
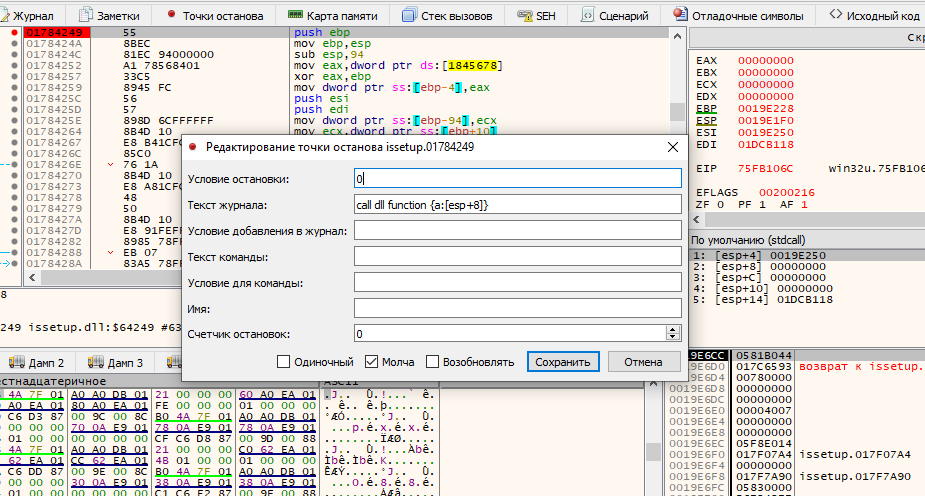
As you can see, the trace has become much more informative:
...
call dll function <isrt._DoSprintf>
call dll function <isrt._SetupTraceWrite>
Strlen L"<IFX_PRODUCT_REGISTEREDOWNER>"
StrSub L"<IFX_PRODUCT_REGISTEREDOWNER>"
Strlen L"<IFX_PRODUCT_REGISTEREDOWNER>"
StrSub L"<IFX_PRODUCT_REGISTEREDOWNER>"
StrSub L"IFX_PRODUCT_REGISTEREDOWNER"
call dll function <isrt._DoSprintf>
call dll function <isrt._SetupTraceWrite>
call dll function <isrt._DoSprintf>
call dll function <isrt._SetupTraceWrite>
Strlen L"<IFX_PRODUCT_REGISTEREDCOMPANY>"
StrSub L"<IFX_PRODUCT_REGISTEREDCOMPANY>"
Strlen L"<IFX_PRODUCT_REGISTEREDCOMPANY>"
StrSub L"<IFX_PRODUCT_REGISTEREDCOMPANY>"
StrSub L"IFX_PRODUCT_REGISTEREDCOMPANY"
call dll function <isrt._DoSprintf>
call dll function <isrt._SetupTraceWrite>
call dll function <isrt._DoSprintf>
call dll function <isrt._SetupTraceWrite>
Strlen L"<IFX_PRODUCT_REGISTEREDSERIALNUM>"
StrSub L"<IFX_PRODUCT_REGISTEREDSERIALNUM>"
Strlen L"<IFX_PRODUCT_REGISTEREDSERIALNUM>"
StrSub L"<IFX_PRODUCT_REGISTEREDSERIALNUM>"
StrSub L"IFX_PRODUCT_REGISTEREDSERIALNUM"
call dll function <isrt._DoSprintf>
call dll function <isrt._SetupTraceWrite>
call dll function <isrt._EndDialog>
call dll function <isrt._ReleaseDialog>
...
But the question remains: how to debug decompiled code without function and variable names? In fact, there is a way to do this. At first glance, it might seem that all functions in decompiled code are nameless and randomly numbered. But in fact, each function contains in its name a number corresponding to its number in the function table provided at the beginning of the script.
This number isn’t calculated automatically: it’s unique for each function and is used (as said above) in the CInternalFuncCallAction action between the opcode and the number of parameters. This number can be retrieved from parameters of the call to CInternalFuncCallAction and logged using a breakpoint like this.
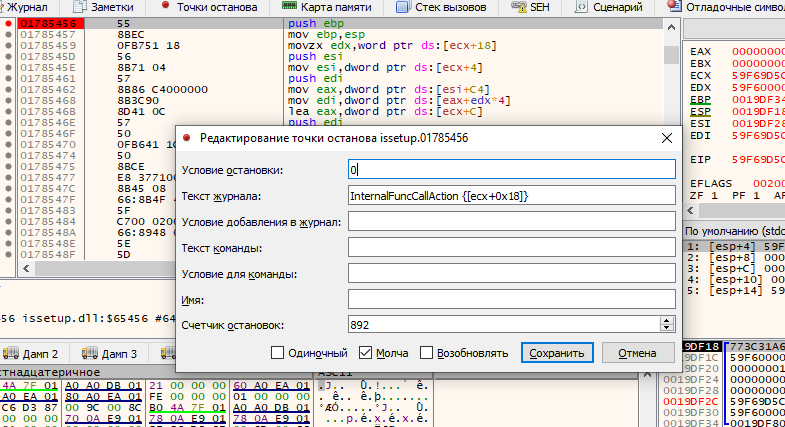
This way, you kill two birds with one stone. First, by logging calls to CInternalFuncCallAction and CDLLFuncCallAction, you explicitly debug the decompiled code, and at any breakpoint you understand inside which function you’ve stopped. Second, by modifying the breakpoint condition, you can ensure a stop on any script function required for your purposes.
Congrats! Not only have you figured out the internal structure of installation scripts, but also learned how to turn x64dbg into a powerful debugging tool for compiled InstallShield installation scripts. And it doesn’t matter that the InstallShield version discussed in this article is obsolete; the principles described in it are still relevant. With a certain desire and skill, you can debug and perform reverse-engineering of scripts even before the release of new decompiler versions for them.
Good luck!